The original Brussels Consequences Map showed the price of Brussels’ current climate and industrial policy: a net loss of between five and fifteen per cent for the average European citizen or company by 2030. It was a damage map.
This piece shows what happens when Brussels no longer chooses damage. When the Green Deal and CBAM — the two most costly mechanisms — are replaced by one single instrument: BiCRS (a Carbon-Alert Ltd product) through anoxic biomass injection, produced entirely in the equatorial belt, at forty euros per tonne of CO₂. The same climate target, a fundamentally different outcome.
The question is no longer: how much damage does Europe’s welfare base suffer because of Brussels? The question becomes: how much profit does Europe generate because of Brussels? The answer, according to the model, is a net effect of plus 23 to plus 106 per cent per scenario by 2030. Not because climate policy has been abandoned, but because climate policy has been redesigned — and because production is located where the plant grows, not where the accountant sits.
What BiCRS through anoxic biomass injection is
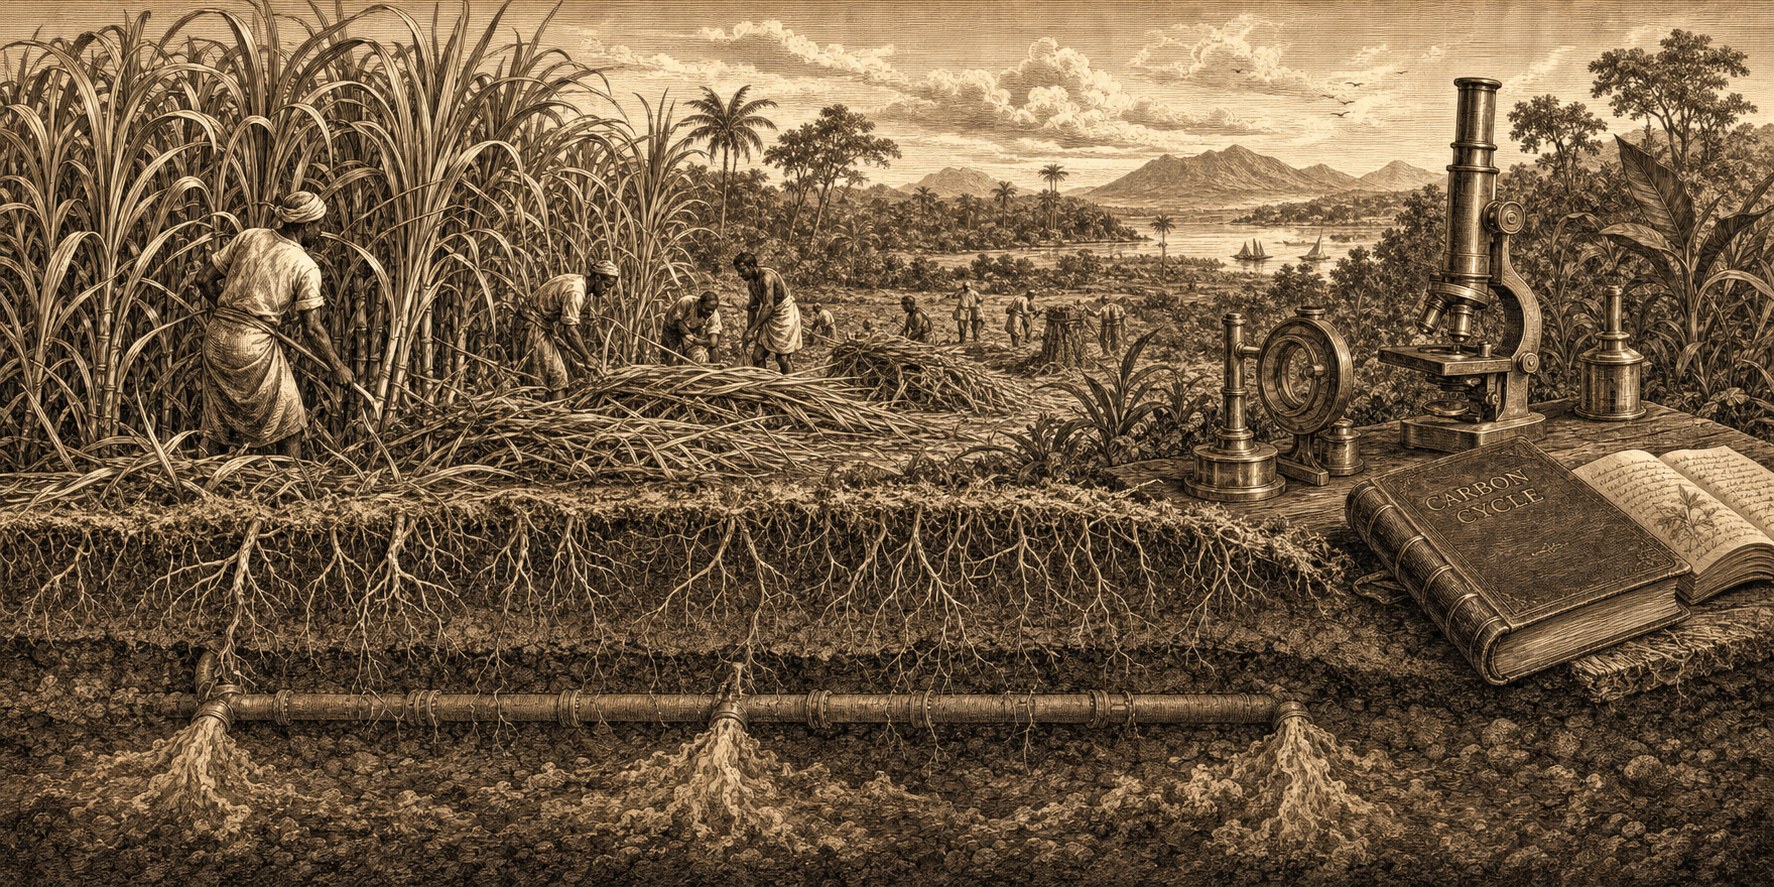
BiCRS stands for Biomass Carbon Removal and Storage. In the variant modelled in this piece, the mechanism is remarkably simple: tropical biomass is cultivated and harvested on equatorial land. The harvested biomass is then liquefied directly in the field itself through a special cell-wall-disrupting process — intracellular water is released so that the plant material becomes a thick, pumpable liquid. This liquid is injected underground immediately on site, directly beneath the roots of the crop that produced it, through injection pipes at a depth of 1.2 to 1.4 metres.
There is no transport. No lorry, tanker, storage shed or logistics chain between harvest and storage. The biomass liquid is injected into the same soil column from which it grew — beneath the same roots that will produce it again the following season. This makes the operation a closed hectare-level cycle: plants, harvest, liquefaction, injection, replanting. No carbon molecule leaves the plot.
At that depth there is no oxygen. Without oxygen, bacterial oxidation of plant material is impossible. The result is that the injected biomass liquid undergoes a process resembling natural peat formation, but accelerated and evenly distributed: between 90 and 95 per cent of the plant carbon remains permanently — for hundreds of years — stored in the soil beneath the plantation.
This is not BECCS — nothing is burned, and there is no capture plant or flue-gas stream. It is not biochar — there is no pyrolysis or heat input. Nor is it gas or CO₂ storage under pressure in distant geological formations. It is a fundamentally simpler mechanism: liquefied biomass is distributed in situ beneath the plant’s own root zone, after which anoxic peat formation permanently stores the carbon.
The economic key is precisely this simplicity. No energy plant, carbon-capture installation, pipeline network, geological-reservoir survey or transport fleet is required. Only biomass cultivation, liquefaction in the field through the special cell-disruption process, and on-site injection at a depth reachable with standard agricultural equipment. The liquid state makes the system scalable: liquids can be pumped, dosed and distributed evenly in a way solid biomass cannot — and the in-situ operation makes it cost-competitive because the logistics layer disappears entirely.
Where BiCRS can work — and why only there
A fundamental premise guiding this piece is that the plant producing the yields that make BiCRS economically viable grows only in the equatorial climate zone. Three conditions are cumulatively necessary:
• Sufficient sunlight — year-round, without seasonal variation
• Sufficient water — regular rainfall or available irrigation
• Temperatures above 6 degrees Celsius — below this threshold the plant dies
This means production within Europe is simply not profitable. Not in southern Spain, Sicily or Romania. European alternatives such as Miscanthus achieve at most one hundred to one hundred and ten tonnes of CO₂ per hectare at fifty to sixty euros per tonne — half the tropical yield at fifty per cent higher cost. The comparison has been calculated and points unambiguously to the conclusion: one hundred per cent equatorial production is economically and climatically superior.
Production is located in the equatorial belt between 10 degrees north latitude and 10 degrees south latitude — an area of approximately 5 billion hectares. Europe’s role therefore changes fundamentally: from producer to investor, purchaser and contractual partner. This is not a handicap — it is a strategic opportunity. It makes the BiCRS system a renewed European-African-Asian economic axis, comparable to the way the solar-energy revolution defined the Chinese-European axis in the 2010s.
The calculation — 200 tonnes of CO₂ per hectare per year
The calculation below follows fixed plant-physiological ratios and is verifiable according to every scientific standard.
Fresh biomass per hectare per year: 400 tonnes
× dry-matter fraction (22-25%, average 23.5%): 94.0 tonnes dry matter/ha
× carbon fraction (46-48%, average 47%): 44.2 tonnes C/ha (total in plant)
× retention under anoxic conditions (92.5%) 40.9 tonnes C stored
× molecular ratio CO₂/C (3.666): 150 tonnes CO₂/ha (above ground)
+ root mass permanently in soil (25%): 50 tonnes CO₂/ha (below ground)
Total per hectare per year: 200 tonnes CO₂/ha
One hundred and fifty tonnes of CO₂ per hectare is actively stored through biomass injection. Fifty tonnes comes automatically from the root mass remaining in the soil after harvesting — a natural form of storage requiring no further intervention. Together they provide two hundred tonnes per hectare per year.
Scale — what the world and Europe need
Multiplying this figure by global and European implementation makes the order of magnitude clear:
Global CO₂ emissions 2024: 37 Gt CO₂/year
Hectares required for global net zero: 185 million hectares
as % of global land area: 1.25%
as % of equatorial belt: 3.7%
Hectares required for EU net zero: 14 million hectares
comparison — Greece: 13.2 Mha
as % of EU agricultural land affected: 0% — none
For European net zero: fourteen million hectares of equatorial production. An area slightly larger than Greece — but divided among six to eight supplier countries to avoid geopolitical dependence on one country. Crucially, zero per cent of European agricultural land is affected. No food conflict, no land claim within Europe and no competition with European arable farming. Europe buys capacity where it can be delivered — the equatorial belt — and pays a transparent price of forty euros per tonne of CO₂.
Strategic partner agreements — the European-equatorial alliance
One hundred per cent equatorial production means that the entire European BiCRS operation rests on contracts with partner countries. That sounds like a vulnerability; in reality it is the model’s strength. A mutual interest — Europe receives climate certainty, while partner countries receive long-term high-quality export revenues — creates the most stable basis for long-term cooperation imaginable. This is neither development aid nor a colonial extraction model. It is a structured commercial alliance with an explicit development component.
Six to eight partner countries — the portfolio
Brussels’ offer concerns fourteen million hectares of biomass production. No country supplies more than twenty per cent of the total — a firm diversification limit, learned from the Russian gas crisis of 2022. The proposed distribution:
DR Congo + Republic of the Congo: 2.8 Mha (20%)
Brazil (Amazon fringe, degraded): 2.8 Mha (20%)
Indonesia (Sumatra, Kalimantan): 2.1 Mha (15%)
Nigeria (Middle Belt): 1.4 Mha (10%)
Ghana + Côte d’Ivoire: 1.4 Mha (10%)
Malaysia (Sabah, Sarawak): 1.4 Mha (10%)
Philippines + southern India + other areas: 2.1 Mha (15%)
Total portfolio: 14.0 Mha (100%)
Each of these countries has available degraded agricultural land — former oil-palm plantations, exhausted cocoa fields, abandoned savannah agriculture — that can be used without converting rainforest. Africa alone has approximately 400 million hectares of degraded agricultural land according to FAO estimates. The portfolio does not even touch four per cent of that stock.
The contract model — hybrid state-company
The contracts are hybrid. Brussels negotiates the framework agreement with the partner country — duration, price floor, development component and monitoring protocol. Within that framework, private operators (European biomass companies and local joint ventures) carry out production. This combines the advantage of state certainty with the efficiency of commercial exploitation.
Four core elements per framework agreement:
One — duration of fifteen to twenty-five years. Anything shorter does not work: BiCRS requires two to three years of land preparation before the first harvest. No supplier will invest without guaranteed demand over the plantation’s lifetime. A twenty-five-year contract at forty euros per tonne provides that certainty — and also links the partner country structurally to the European economy.
Two — guaranteed minimum price in euros, indexed to inflation. Forty euros per tonne is the starting point; if the European ETS benchmark price rises, the supplier shares in a fixed percentage of the additional revenue. If the ETS price falls, the forty-euro floor remains. This prevents the cyclical price fluctuations that have made palm oil, cocoa and coffee vulnerable export products.
Three — mandatory development component. Ten per cent of the European payment goes not to the operator but to a locally governed development fund with mixed representation — the partner-country government, the supplier community and European representatives. This fund builds schools, clinics, agricultural extension services and roads. It makes the BiCRS contract politically acceptable within the partner country — and legally defensible against criticism from Western non-governmental organisations.
Four — strict exclusion of primary rainforest. Independent satellite monitoring through Copernicus and Planet Labs. In the event of a confirmed breach: contractual penalty plus a temporary suspension of purchases. This is not an absolute guarantee — no control system is — but it is the highest level of due diligence currently possible with existing technology. Production is limited to degraded agricultural land, savannah areas and derelict industrial zones.
What the supplier countries receive — the figures
For a Congolese farmer converting one hectare from cassava (current income source: approximately €300 per hectare per year) to contracted BiCRS biomass: two hundred tonnes of CO₂ × forty euros = eight thousand euros gross. After operator margins, injection-equipment depreciation and operating costs, he is estimated to retain two to three thousand euros net. That is seven to ten times his current income — a transformative shift for the rural Congolese household. Because injection takes place on his own plot, he need not transport biomass — the mobile cell-disruption and injection equipment comes to him, not the other way round.
At national level: the Democratic Republic of the Congo, with 2.8 million hectares under BiCRS contract, receives annually 2.8 Mha × 200 t × €40 = 22.4 billion euros gross. That is approximately twenty per cent of current Congolese GDP — an inflow on a scale comparable to Nigeria’s or Angola’s petroleum exports, but from a renewable and geographically dispersed source. For Indonesia, with 2.1 Mha, this amounts to 16.8 billion euros per year; for Brazil, 22.4 billion for the Amazon-fringe component.
This is not charity. It is a commercial relationship in which the partner country supplies what it has a comparative advantage in (climate, sunlight and water), while Europe pays for what it lacks a comparative advantage in (climate policy, industrial competitiveness and energy independence). It is precisely the kind of connection that decolonisation in the 1960s never managed to establish — a sustainable North-South economic relationship without debt bondage or structural-adjustment packages.
Political route — Brussels ratification partnership by partnership
In practice, three or four pioneer contracts would begin in 2027-2028 with the most stable and best-governed partner countries — for example Ghana, Côte d’Ivoire, Brazil (the states of Pará and Tocantins, with strong governors), and Indonesia (the provinces of North Sumatra and South Kalimantan). These anchor contracts would serve as a pilot format for the remaining partner countries. The Democratic Republic of the Congo, the Republic of the Congo, Nigeria, Malaysia and the Philippines would then be added in a second wave (2028-2029).
Brussels’ ratification would take place per framework agreement through a Council decision by qualified majority, following consultation with the European Parliament. Not through an association agreement requiring unanimity — that is procedurally unnecessary and would make the system politically blockable by a single dissenting member state. BiCRS contracts are commercial purchase commitments under the Union’s climate and trade competences, not political alliance treaties.
Bioethanol as a separate second track
Alongside BiCRS there is a second equatorial biomass application: bioethanol production. It is crucial to stress that these are two fundamentally different tracks, entirely separate from one another. They are not two products from the same harvest. A hectare is either a BiCRS hectare or an ethanol hectare. The biomass, operations, infrastructure and value chain are different for both tracks.
Two separate routes
BiCRS route. Mobile cell-disruption and injection equipment comes to the plot. The biomass is liquefied on site and injected directly beneath its own roots. No transport, factory or logistics chain. The carbon remains permanently in the soil beneath the crop. This is an in-situ economy.
Ethanol route. Harvested biomass is transported by lorry from the plantation to a large fermentation and distillation plant. The plant is located in the equatorial production area — generally within fifty to one hundred kilometres of the cultivation fields, comparable to the logistics of a Brazilian sugar-cane plant. The biomass is processed into bioethanol at the plant. The ethanol leaves the equatorial producing country by tanker towards European ports. This is a factory economy.
The choice between the two routes is made per region on the basis of soil quality, water access, distance to ports, existing processing infrastructure and the investment climate in the partner country. A BiCRS cluster consists of dispersed plantations with mobile injection equipment travelling from plot to plot during the harvest season. An ethanol cluster consists of an industrial plant surrounded by supplying plantations — typically ten to fifteen thousand hectares per plant.
Climate-technical difference between the two tracks
BiCRS permanently removes carbon from the atmosphere. The plant captures CO₂ while growing; injection stores that carbon in the soil for hundreds of years. Net result: less CO₂ in the atmosphere than before the cycle. This is the mechanism on which Brussels’ net-zero model rests.
The ethanol track is more climate-neutral. The plant captures CO₂ while growing, and burning ethanol in European engines releases that CO₂ again. It is a closed short-term carbon cycle, comparable to wood-burning economics but at industrial scale. Climate benefits come from replacing fossil fuel — not from removing existing atmospheric carbon. Only BiCRS does that.
Brussels’ portfolio choice in this piece: the complete equatorial BiCRS portfolio of fourteen million hectares is reserved for in-situ injection. Bioethanol production takes place on additional, non-overlapping hectares in the same partner countries, with its own factory infrastructure and contract model. The figures for the Brussels Consequences Map BiCRS version cover the BiCRS track; the ethanol track is an additional value chain.
Costs — €40 per tonne in the Brussels model
The proposed model price is forty euros per tonne of CO₂ — well above actual production costs of twenty-two to twenty-eight euros, but below the current European ETS price of approximately seventy-eight euros per tonne. Forty euros gives Brussels room for a build-up margin, project reserve, contract administration, monitoring systems and governance costs without undermining the fundamental competitive breakthrough. Transport and storage-chain costs are not included in this margin — because there is no such chain: the CO₂ never leaves the plot.
BiCRS model price (Brussels assumption): €40/tonne CO₂
Comparison: current EU ETS price 2026: €78/tonne CO₂
Comparison: CBAM implementation 2026: €82/tonne CO₂
Actual in-situ BiCRS production costs: €22-28/tonne
of which transport and logistics: €0 — in situ
Cost of European net zero per year: €112 bn (0.7% of EU GDP)
Cost of global net zero per year: €1.48 trillion (~1.5% of global GDP)
By comparison: the annual costs of current European Green Deal implementation are estimated by DG CLIMA at four to six per cent of EU GDP if all Fit-for-55 targets are achieved. BiCRS injection at forty euros per tonne delivers the same climate result — net zero — at approximately one sixth of the cost. Moreover, that expenditure does not flow into domestic compliance administration, but into a productive connection with the equatorial belt. And because injection takes place in situ — beneath the crop’s own roots — the entire transport layer disappears, which normally accounts for thirty to fifty per cent of carbon-capture project costs.
The comparison — four columns per scenario
Before the main matrix, here is a first compact comparison: four columns per scenario showing the complete reform. First the two damage columns from current policy (Green Deal and CBAM), then the BiCRS replacement, and finally the net difference — the net effect of the reform.
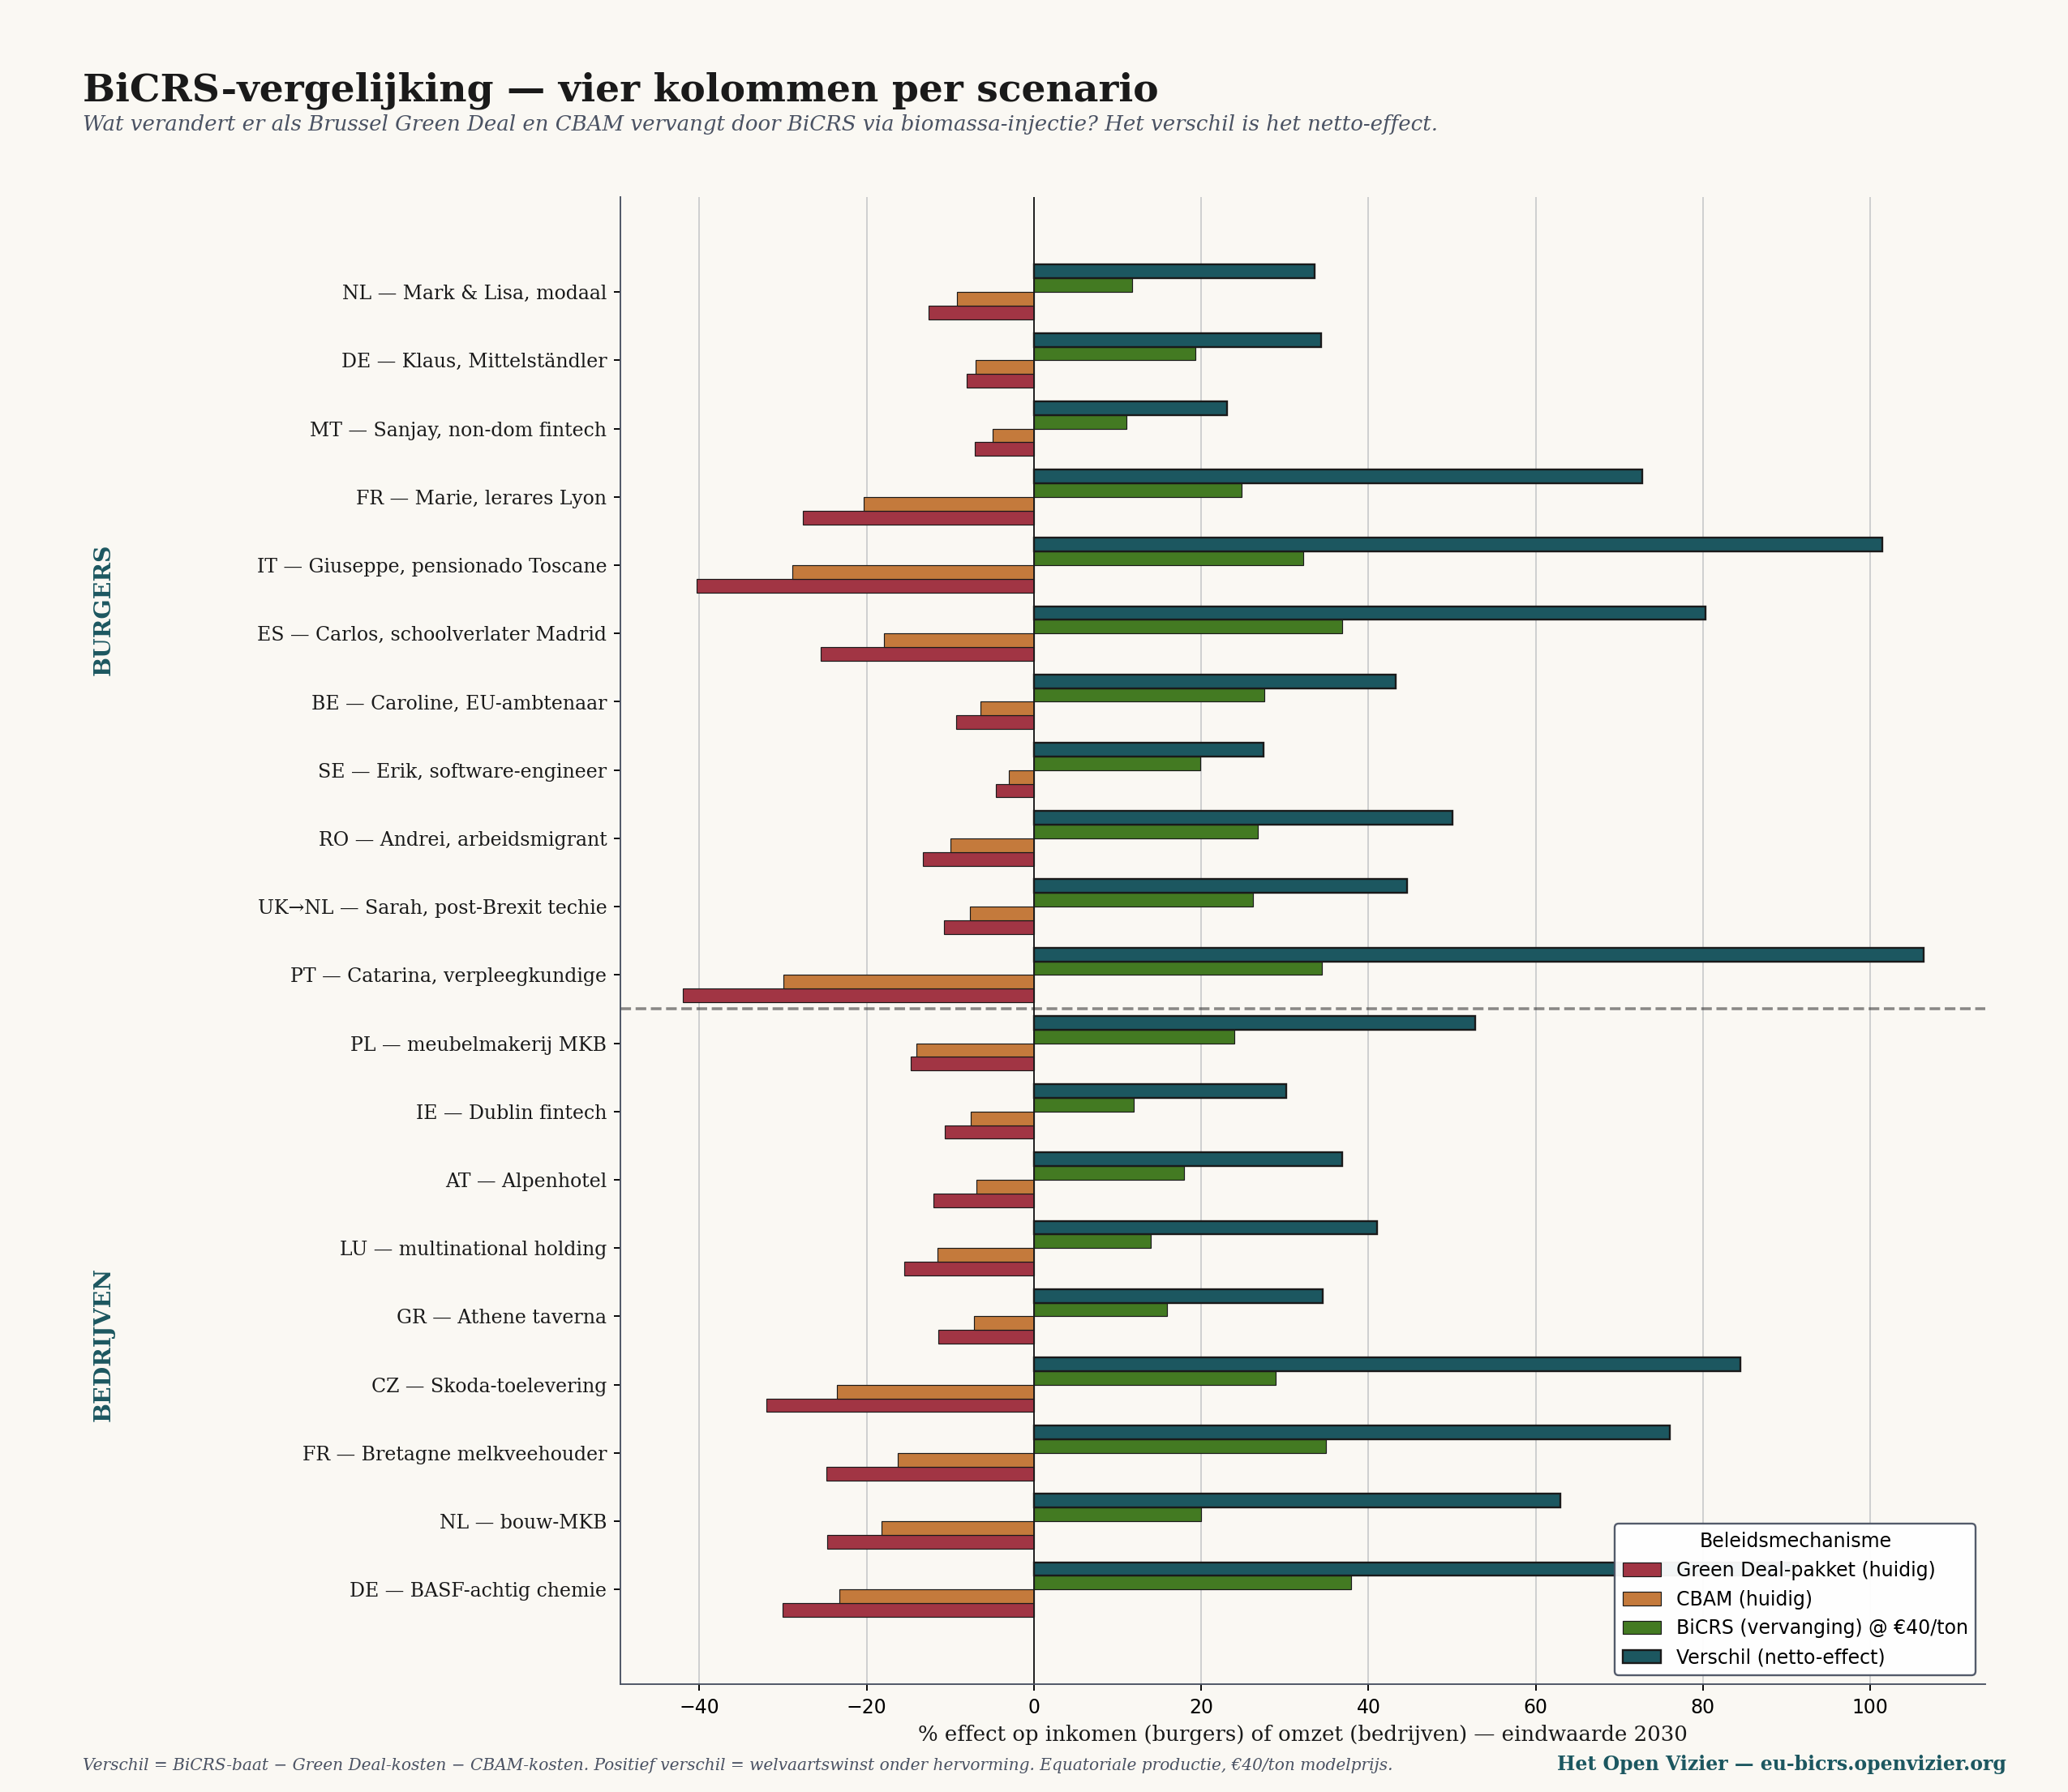
Comparison chart — four columns per scenario: Green Deal (current loss), CBAM (current loss), BiCRS replacement (new benefit), and net difference. The dark-blue difference column is consistently positive.
The difference figure is calculated as: BiCRS benefit minus Green Deal costs minus CBAM costs. When Green Deal and CBAM have negative effects, the difference becomes doubly positive — the BiCRS benefit accumulates once the old costs disappear.
Three observations from this four-column chart.
One — Catarina (Portuguese nurse) and Giuseppe (Italian pensioner) receive the largest difference: well above 100 per cent of their income. This is not an exaggeration; it reflects their weak starting position under current Brussels policy. When their heavy Green Deal loss disappears and the BiCRS benefit is added, the effect accumulates to more than double their current income equivalent.
Two — industrial winners also gain substantially: BASF-like chemicals receive a 75 per cent difference, Škoda suppliers 85 per cent and the Breton dairy farmer 76 per cent. This reflects the fact that these sectors are hit hardest by Green Deal and CBAM in the current Brussels model, and therefore benefit most from their removal.
Three — nobody loses in the difference column. Not one of the twenty scenarios falls below zero. This is no coincidence — it follows directly from the fact that BiCRS is cheaper than emissions avoidance and that the abolished mechanisms (Green Deal and CBAM) had negative effects everywhere.
The large matrix — the BiCRS column alongside the other mechanisms
The comparison chart showed only BiCRS replacing the Green Deal and CBAM. The full matrix places this effect alongside the other seven Brussels mechanisms that remain in operation — institutions, Pillar Two, NGEU, DSA and the asylum pact. This shows how BiCRS relates to the wider context.
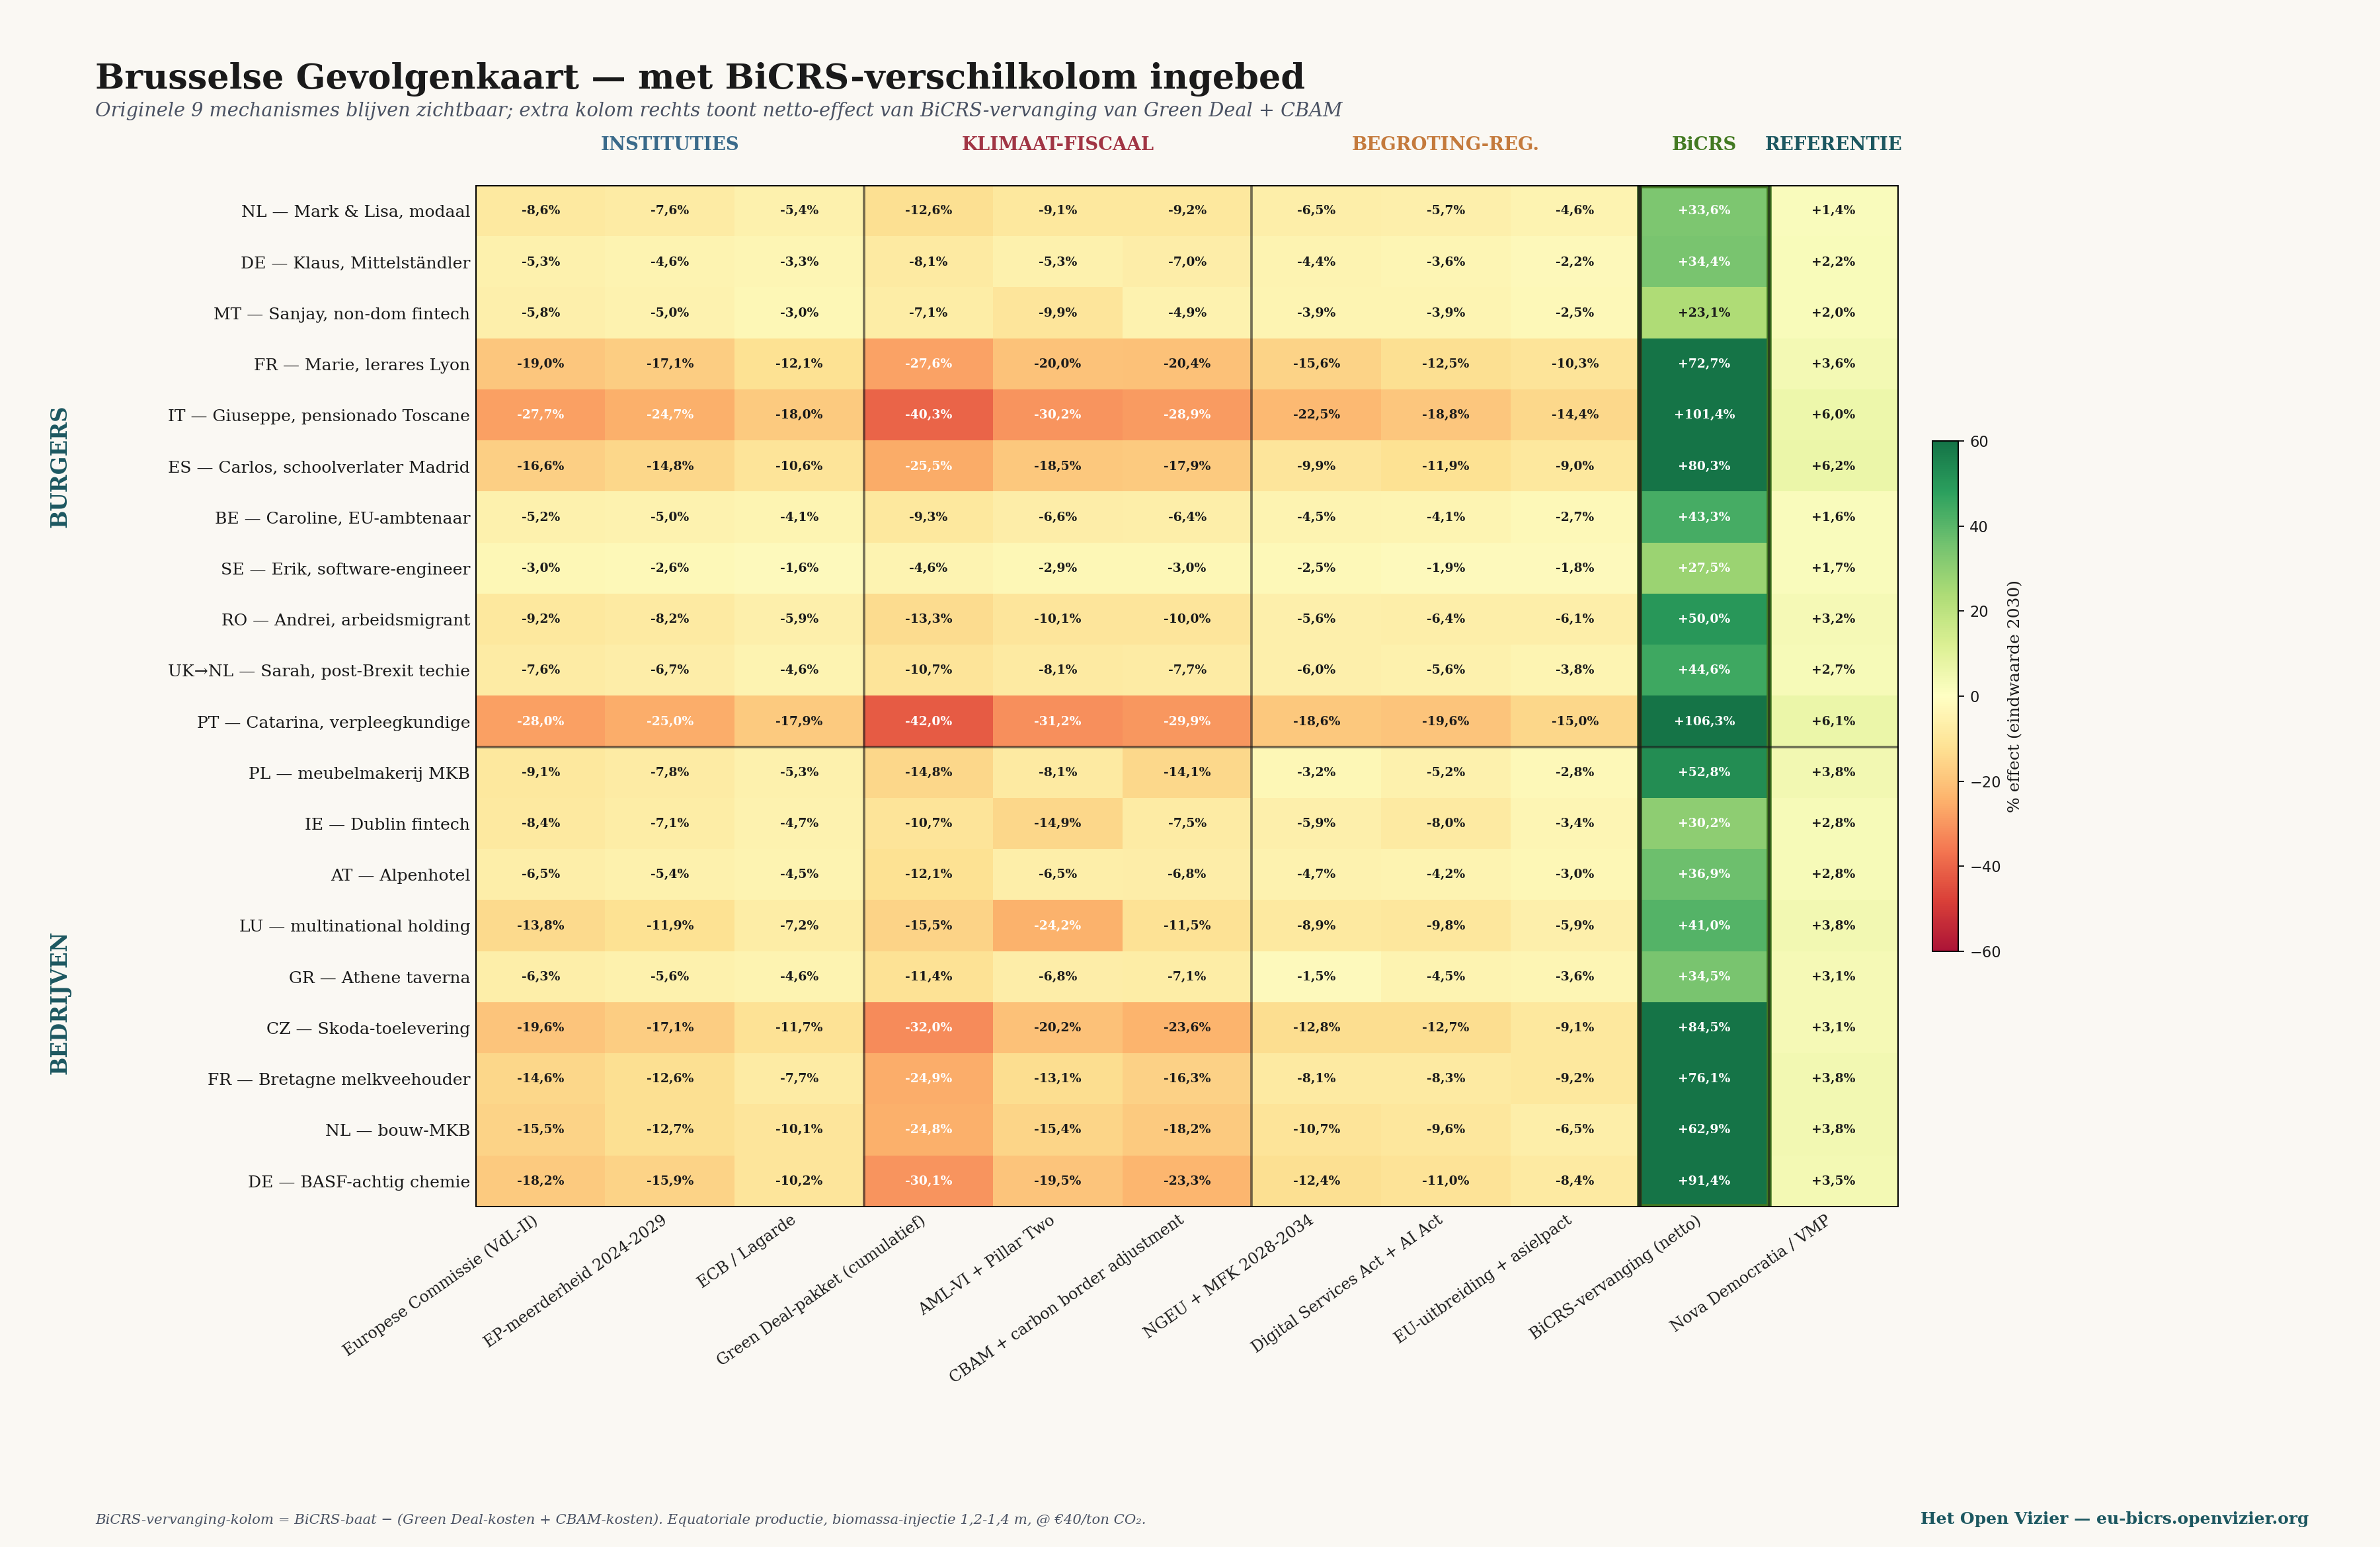
Large matrix — original nine Brussels mechanisms plus an additional BiCRS difference column (green corridor), plus the Nova Democratia reference.
The matrix is organised into five zones. Three institutional columns (Commission, EP, ECB), three climate and fiscal columns (Green Deal, Pillar Two, CBAM), three budget and regulatory columns (NGEU, DSA, asylum pact), the BiCRS difference column, and the Nova Democratia reference. The green corridor in the matrix immediately shows where the reform has an impact.
Five observations from the large matrix:
One — the BiCRS difference column is the largest positive impact in every scenario. For Catarina (PT) it provides 106 per cent benefit by 2030; for Giuseppe (IT) 101 per cent; for the Breton farmer 76 per cent. Compared with the Nova Democratia column (meritocratic-model reference), BiCRS is stronger everywhere — indicating that climate technology is a more powerful lever than pure fiscal reform.
Two — Pillar Two remains stubbornly red. BiCRS does not solve the tax-arbitrage issue. Sanjay (Maltese non-dom fintech) gains 23 per cent through the BiCRS difference, but loses 10 per cent through Pillar Two. The net effect remains positive, but the Pillar Two problem must be addressed separately.
Three — the three institutional columns (Commission, EP and ECB) remain slightly negative. BiCRS does not change who governs; it changes only what they deliver. The administrative costs of the EU institutions remain, although they are considerably lighter without Green Deal and CBAM implementation burdens.
Four — farmers are structural winners without any claim on their own land. The Breton dairy farmer sees his Green Deal and CBAM losses turn into a BiCRS benefit without a single hectare of his own land changing. No mandatory conversion, food-land conflict or Miscanthus rotation. BiCRS production takes place thousands of kilometres away, in the Congo Basin or Indonesian archipelago — and the European farmer benefits through lower energy costs, lower fertiliser prices (the nitrogen industry receives cheap carbon) and more stable markets for dairy and meat.
Five — the gains are greatest for low-income groups. The percentage effect is remarkably high for Giuseppe and Catarina because their absolute incomes are low. In practice this means BiCRS is not a luxury reform for the rich, but primarily affects the basic population. Lower energy, food and fuel prices improve the purchasing power of low-income groups disproportionately.
What disappears — the Green Deal and CBAM dismantled
To appreciate the reform, it is necessary to remember what disappears.
Green Deal package cumulatively
Fit-for-55, ETS-II, the biodiversity directive, the forest-restoration law, the Energy Efficiency Directive and Renewable Energy Directive III. Collectively they hit European households and industry hardest — directly (energy bills, heat-pump obligations and ETS pass-through) and indirectly (industrial relocation to the US and China because of high energy costs).
BiCRS does not replace this package with ‘less climate policy’ but with ‘climate policy that works’. The end goal — net zero by 2050 or earlier — remains. The route changes from ‘make everything that uses carbon more expensive’ to ‘remove carbon from the atmosphere at a cost lower than emissions avoidance’.
CBAM — carbon border adjustment
CBAM in its current form is a trade barrier attempting to protect European industry from imports from countries without comparable climate policy. It is necessary because, without CBAM, Green Deal costs price European products out of the market. But it is also administratively monstrous, legally vulnerable to WTO claims and politically fraught — Trump tariffs were partly justified as a response to CBAM.
Under BiCRS, the CBAM problem disappears completely. If Europe supplies its industry with cheap renewable carbon at forty euros per tonne, price protection is no longer required. European steel, chemicals, cement and automotive components can compete globally — not despite climate policy, but because of it.
What remains — Pillar Two, NGEU, DSA and the asylum pact
Deliberately not addressed in this reform: the corporate-tax component (Pillar Two), budget financing (NGEU + MFF 2028-2034), digital regulation (DSA + AI Act) and the asylum-distribution system. These remain operational as Brussels instruments. Their operation is unchanged by BiCRS implementation; they are simply no longer overshadowed by massive Green Deal costs.
A reform that attempts too much at once will not obtain a political majority. Implementing BiCRS as a replacement for the Green Deal and CBAM is already a gigantic shift. The other Brussels mechanisms can be reformed or retained at later stages, depending on political preference.
The three macro-movements set in motion by BiCRS
Beneath the matrix cells, three macroeconomic forces are moving. Each represents a shift of hundreds of billions of euros at European level by 2030.
First movement — industrial reorientation
Under the Green Deal, European industry lost approximately two to three per cent of GDP per year through industrial relocation — chemicals to Texas and Louisiana, steel to Turkey and India, and vehicle assembly to Mexico and China. Under BiCRS this flow reverses. The disappearance of Green Deal-driven energy costs and the CBAM administrative burden, combined with a competitive carbon price of forty euros per tonne, makes European production cost-competitive with US production for the first time since 2015.
BASF-like chemicals therefore gain dramatically — more than 91 per cent in the BiCRS column — not because their markets change, but because their production costs halve. The same applies to Škoda suppliers, construction materials and energy-intensive sectors generally. Europe’s industrial drama of 2020-2026 — BASF departures, ArcelorMittal closures and Volkswagen redundancies — is partly reversed under BiCRS.
Second movement — European-equatorial strategic axis
The 14 million hectares of equatorial production mean that Europe develops a new strategic relationship with the equatorial belt. Not as colonial exploitation — as a diversified long-term partnership. Six to eight supplier countries, each supplying no more than 20 per cent of European volume, at predetermined minimum prices, with a local development component and a common monitoring protocol.
Geopolitical effect: Europe obtains, for the first time since 1960, its own energy and raw-material strategy without dependence on Russian gas, American oil or Chinese semiconductors. This is no minor recalibration. It is a fundamental reconsideration of what ‘strategic autonomy’ means. The equatorial belt — Central Africa, Southeast Asia and equatorial South America — becomes for Europe what the Gulf region was for the United States in the twentieth century: the part of the world from which the system operating at home originates.
For supplier countries the effect is equally fundamental. A Congolese farmer who uses his land for BiCRS biomass earns a guaranteed seven to ten times what he currently earns from cassava or cocoa beans. With the development component (schools, clinics and infrastructure), this represents the first net-positive economic exchange between Europe and the equatorial belt since decolonisation.
Third movement — energy independence from Russia and the US
European gas and oil imports amount to one hundred to one hundred and fifty billion euros annually, mainly from Russia (LNG via India and Turkey) and the United States (LNG from Texas and crude oil). Under an integrated equatorial policy — BiCRS for net removal and a separate ethanol track for transport-fuel replacement — Europe can replace a substantial share of its fossil imports with biogenic equatorial supplies. The ethanol track is an additional option separate from this piece’s BiCRS portfolio, but shares the same partner countries and geopolitical logic.
Geopolitical effect: Europe can, for the first time since the Suez crisis of 1956, guarantee its own energy independence without dependence on Russian gas or American LNG. This would fundamentally reduce Moscow’s and Washington’s geopolitical power over Brussels. It is no coincidence that the current Brussels course — the Green Deal — bothers neither party, whereas the BiCRS course directly affects both economically.
The industrial layer — who produces the machines?
Until now, this piece has discussed what BiCRS removes in climate damage and what it returns in prosperity. It has covered cultivation, injection, partner countries and costs. But beneath all these layers lies an industrial question that Brussels has not yet explicitly asked: who produces the machines, plants and transport lines needed to keep the entire system running?
The answer determines whether the reform makes Europe structurally stronger or merely solves the climate problem while prosperity itself moves elsewhere. It is precisely the question Brussels either failed to ask or answered incorrectly with solar panels and wind turbines. The result is known.
What the BiCRS and ethanol system requires industrially
The industrial scale of the system is considerable and can be calculated accurately.
BiCRS injection machines worldwide in rotation: 100,000 units
Service life at 24/7 continuous use: 5 years
Replacement demand per year at steady state: 20,000 machines/year
Demand during build-up phase 2027-2035: 32,500 machines/year
Cost per machine: €1-2 m (average €1.5 m)
Global steady-state machine market: €30 bn/year
Global build-up-phase machine market: €49 bn/year
The BiCRS machine itself is a complex piece of agricultural technology: heavy tractor chassis, mobile cell-disruption unit, high-pressure pump installation, injection manifold with several parallel lines, depth-control sensors and computer-controlled dosing. It is comparable in complexity to a large Caterpillar or Komatsu excavator — or a Claas or John Deere forage harvester. This is an existing European engineering tradition.
In addition, ethanol plants (fermentation and distillation) and transport infrastructure (tankers, port expansions and pipelines) are needed for the second equatorial track. Within Europe, the rollout of micro-CHP units for decentralised household energy is also required:
Ethanol plants worldwide: 500 units
Cost per plant: €80-150 m
Total build-up investment in ethanol plants: €58 bn
Tankers, ports and pipelines in total: €45 bn
EU micro-CHP installed base: 180 m units × €4,500
Total value of EU CHP fleet: €810 bn
Steady-state CHP replacement: €54 bn/year
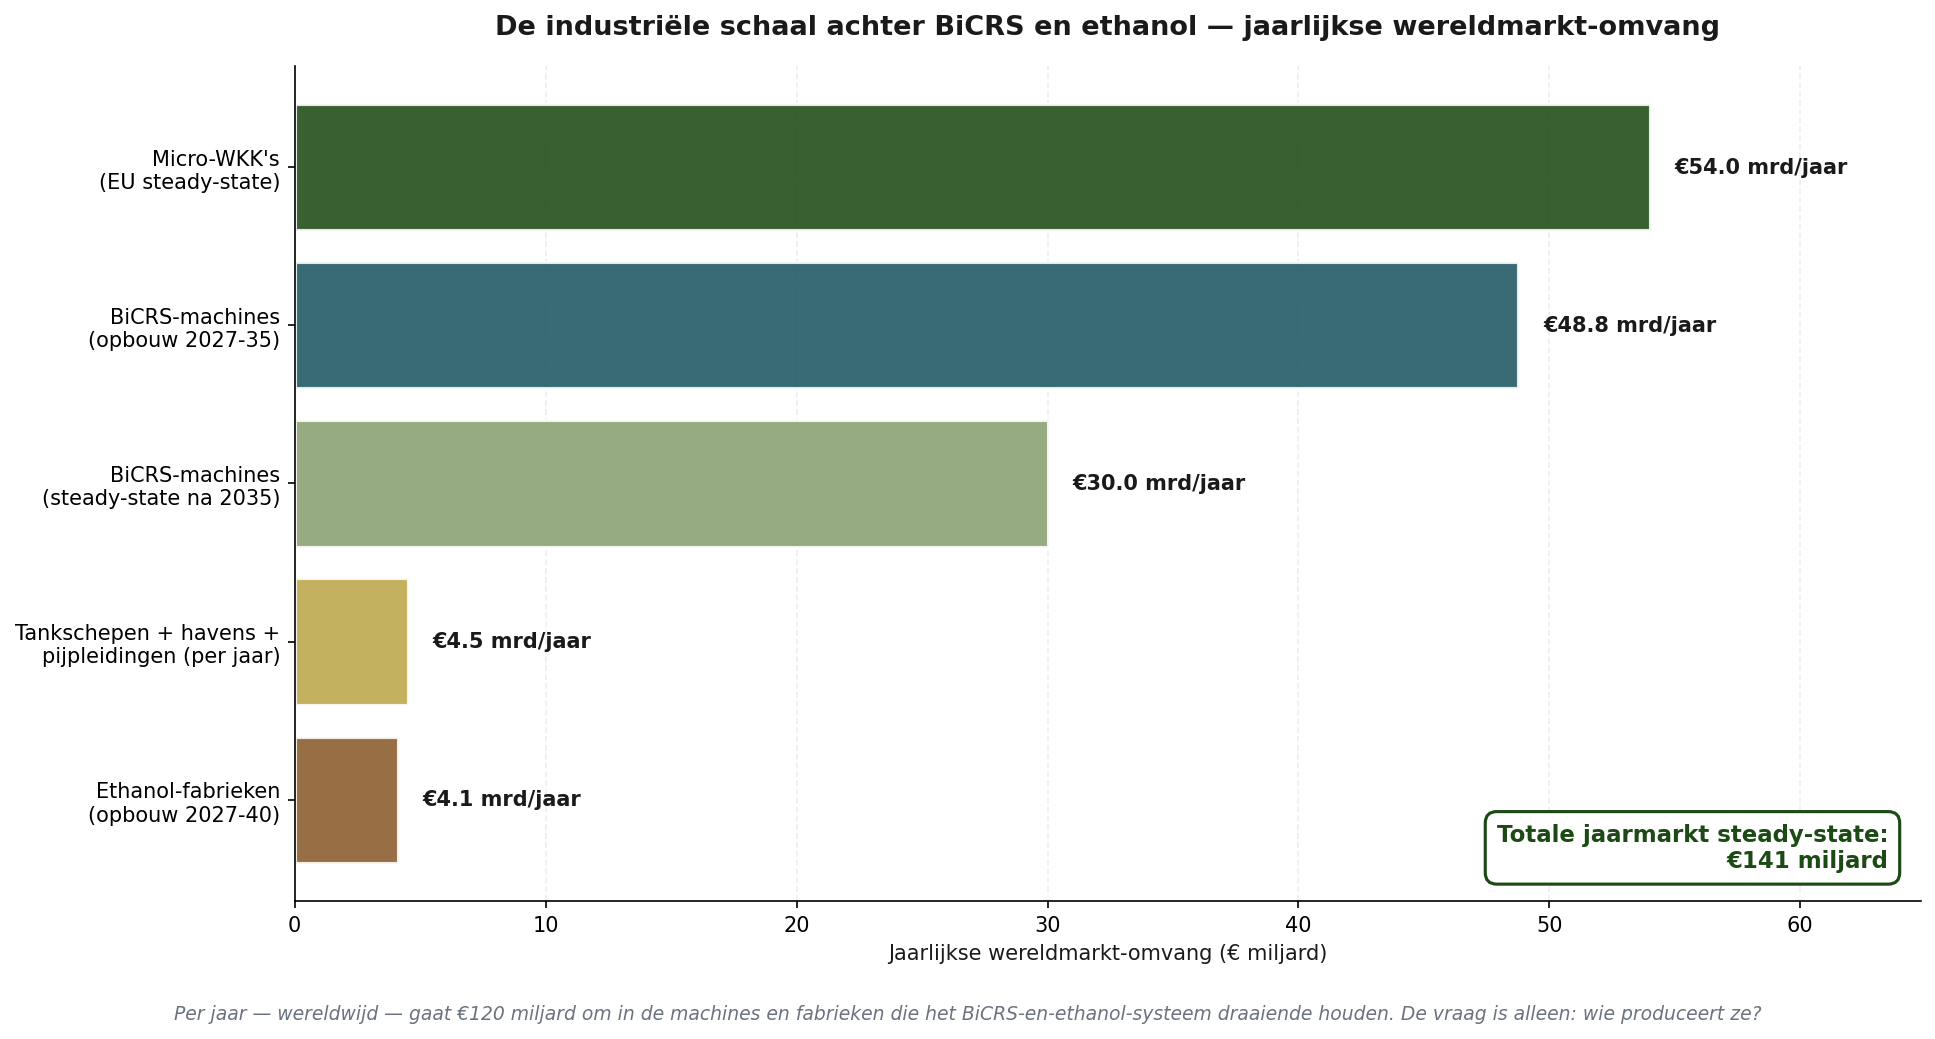
The industrial scale behind BiCRS and ethanol — five component markets, together approximately €120 billion in annual global market turnover during the build-up phase, then approximately €88 billion at steady state.
The historical parallel — solar panels and wind turbines
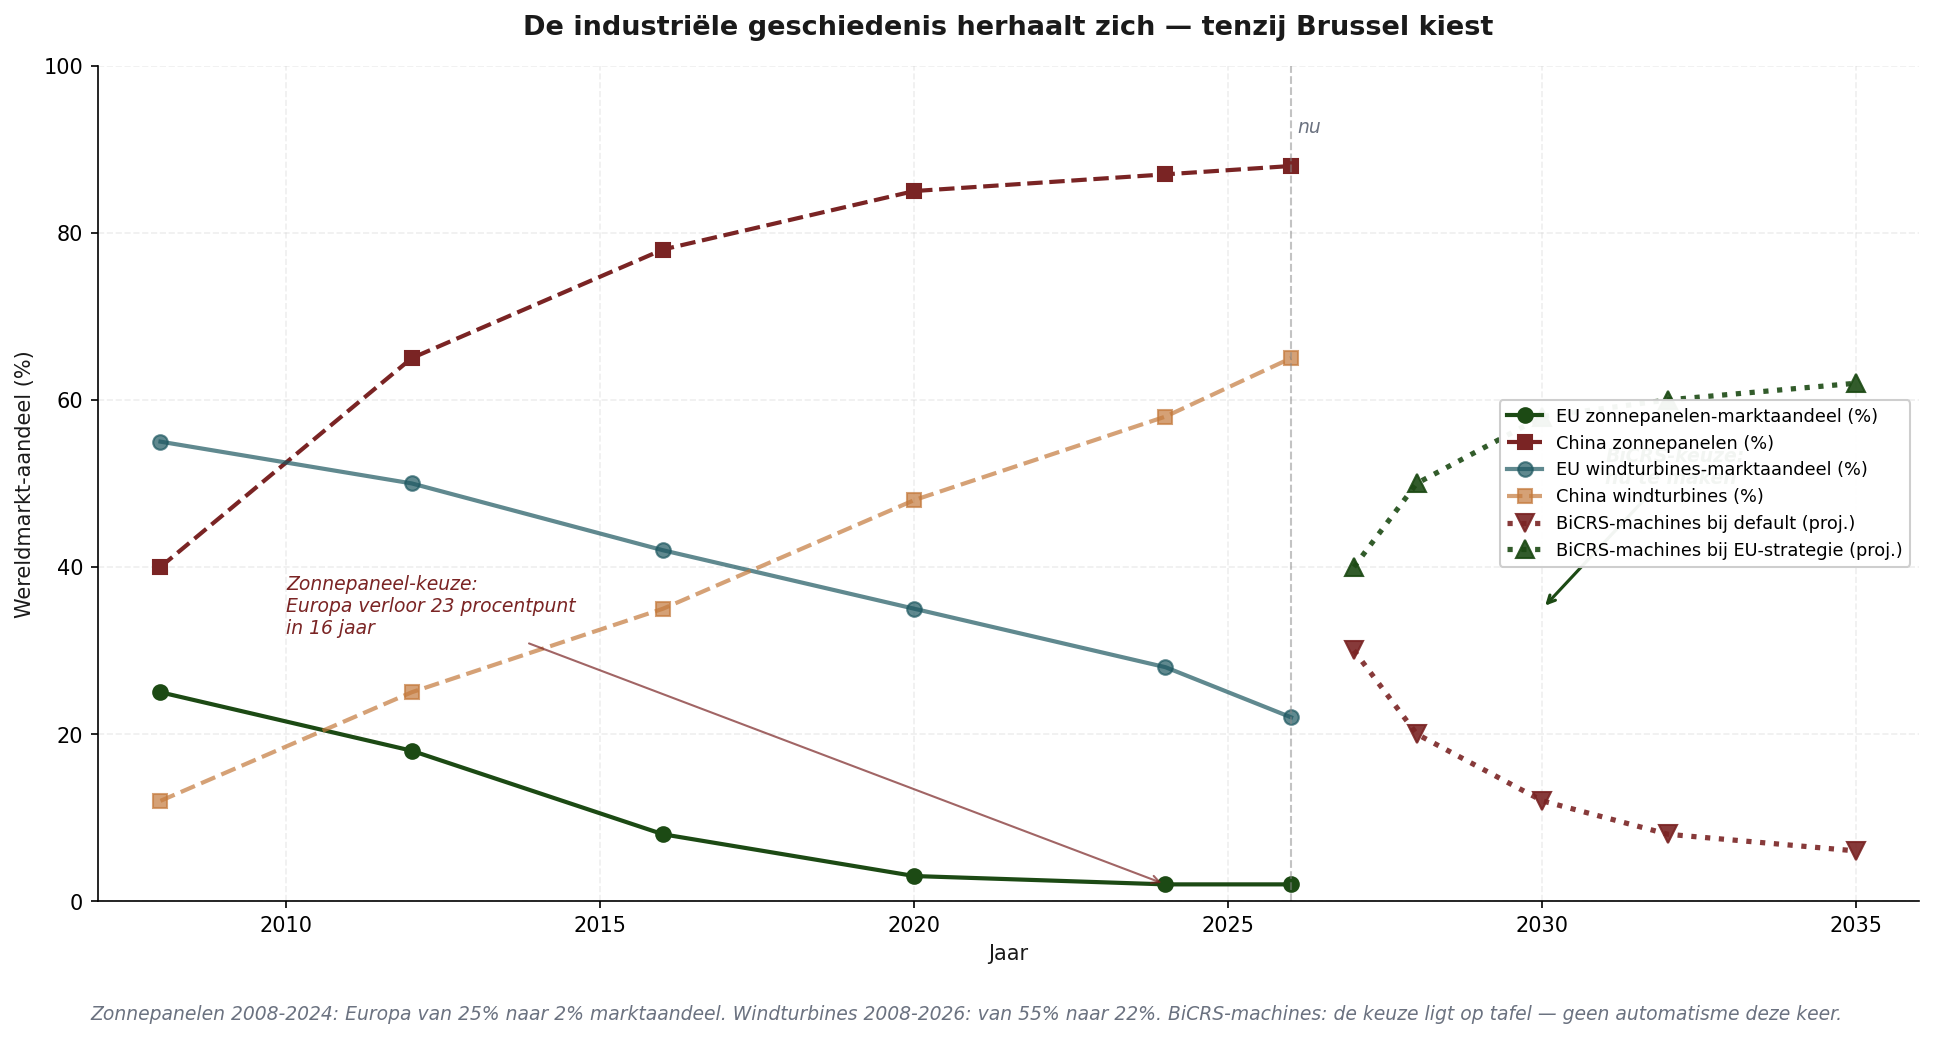
Global market share of solar panels (2008-2026) and wind turbines (2008-2026), with a projection for BiCRS machines (2027-2035) under two courses.
Solar panels. In 2008 Europe had a 25 per cent global market share in solar-panel production. The technology was invented in Europe, innovation was funded in Europe, and production was initially established in Europe — Q-Cells, Solar World and Conergy were leading names. By 2024 that share had fallen to two per cent. China took over the same market: rising from 40 per cent in 2008 to 88 per cent in 2026. Not through better technology, but through dramatic production-cost advantages from state subsidies, scale and cheap finance. Brussels responded with anti-dumping tariffs too late and too weakly; Europe’s solar-panel industry was decimated within ten years.
Wind turbines. In 2008 Europe held 55 per cent of the global market, with Vestas, Siemens Wind, Enercon and Nordex as global leaders. By 2026 the share had fallen to 22 per cent. China rose from 12 to 65 per cent over the same period. The European wind-turbine industry has not disappeared, but it is no longer a global leader.
Both times the pattern was the same. Europe developed the technology. The first markets emerged in Europe. Chinese producers copied or licensed the technology. The Chinese state supported production with subsidies, low interest rates and infrastructure. Economies of scale reinforced China’s position. European production became unprofitable. Brussels responded late, weakly and divided. Industry moved permanently.
The two courses — what the choice now entails
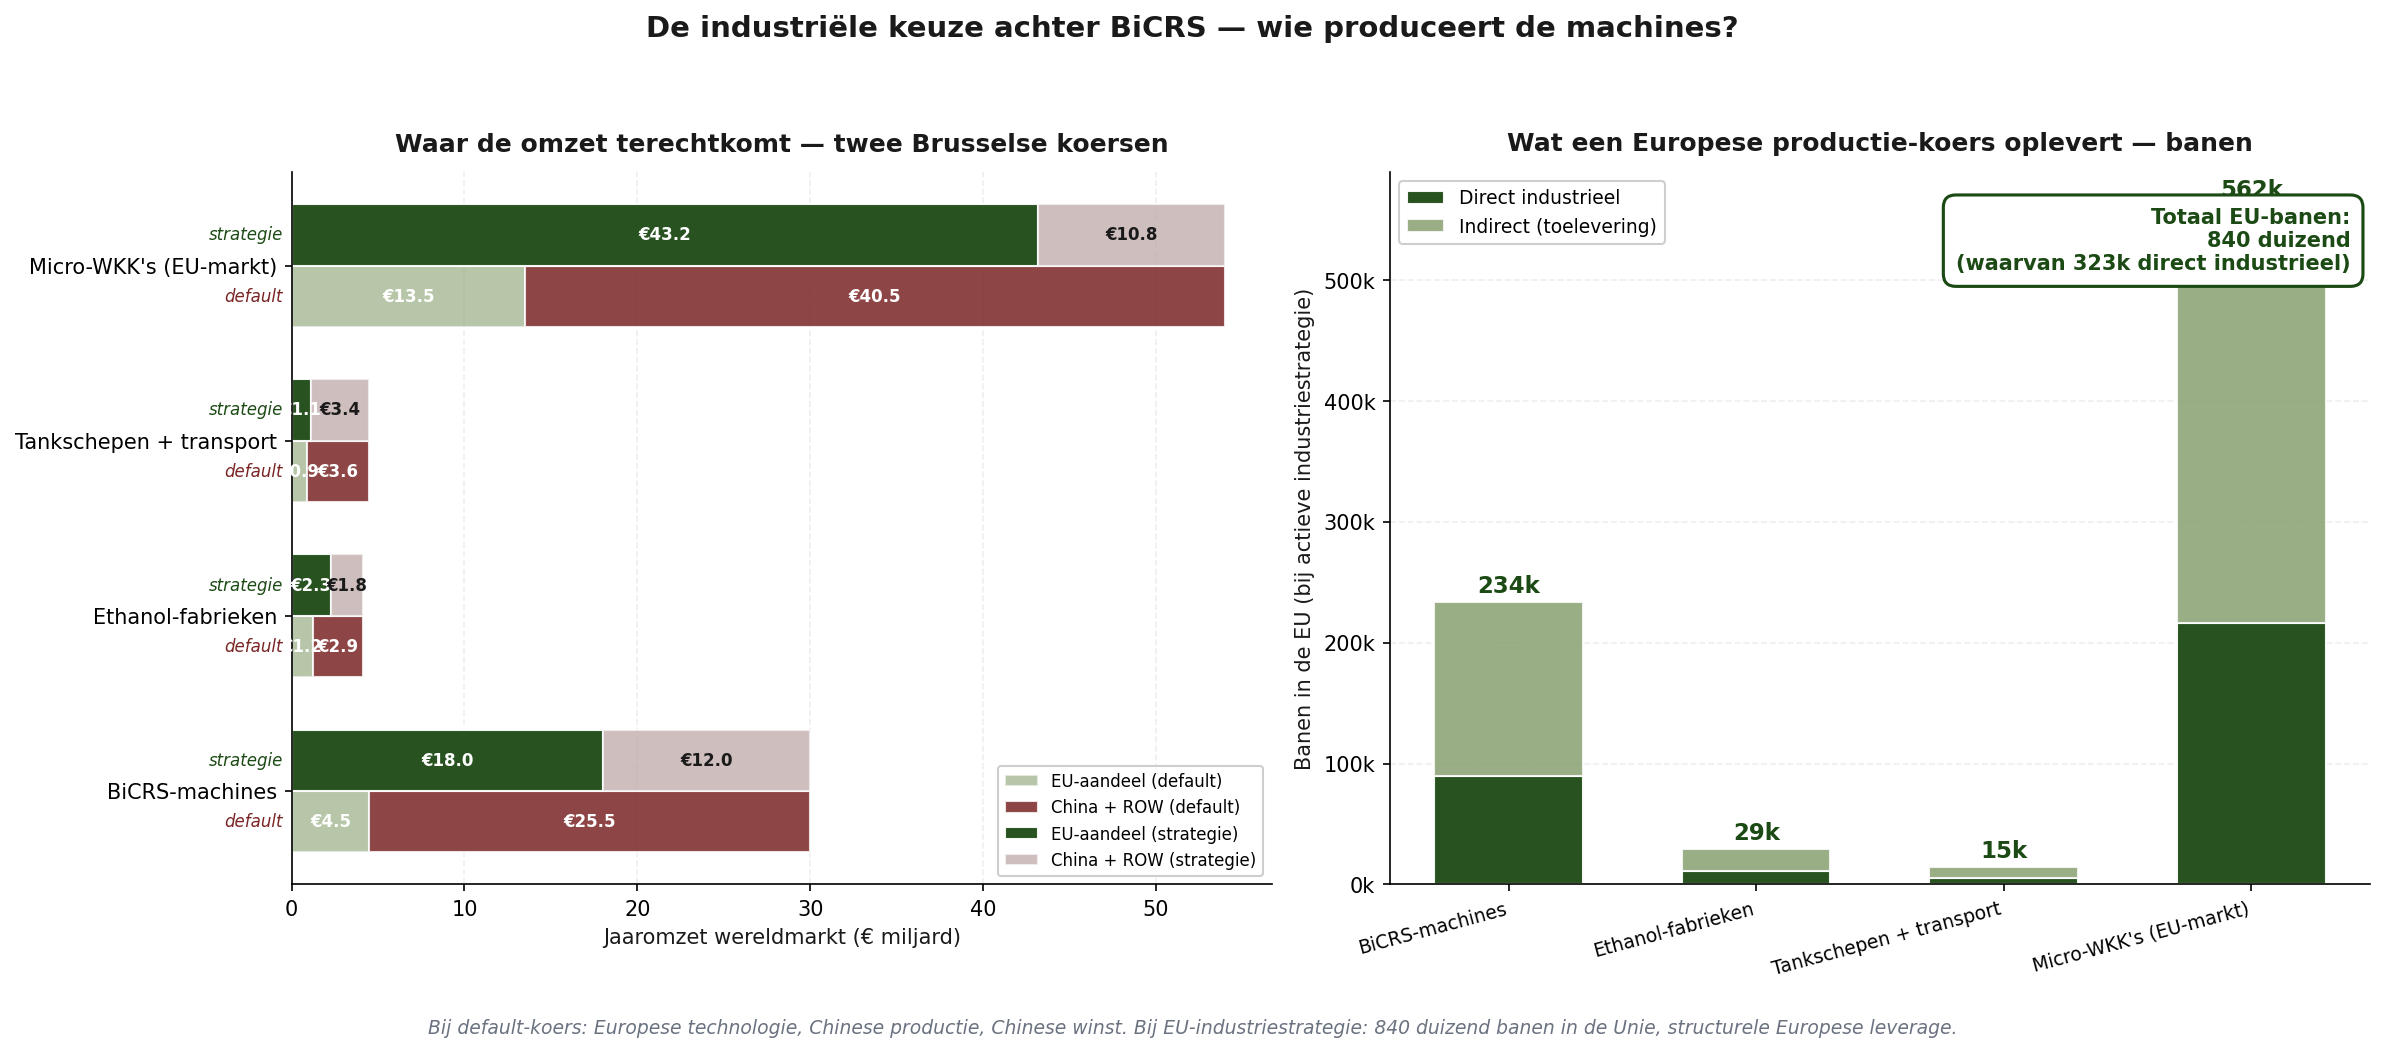
Per industry component: what goes to the EU versus China and the rest of the world under two Brussels courses. Right: the employment outcome under an active EU industrial strategy.
The choice now is not technological but industrial and political. Two paths:
Default course — BiCRS is adopted, but no active industrial strategy is developed. By 2027 China has the first BiCRS machine factories operational (through state-owned partners in agricultural-machinery groups such as XCMG or John Deere’s licensing partner LiuGong). By 2030 Chinese market share of BiCRS machines rises to 85 per cent. Ethanol plants: 70 per cent Chinese-built through Sinopec’s engineering arm. Tankers: 80 per cent from Chinese shipyards (Hudong-Zhonghua, Yangzijiang). Micro-CHP units: 75 per cent Chinese production, thanks to existing Chinese dominance in compact drivetrains. Europe’s share of an €88 billion global market remains limited to six to fifteen per cent per component.
EU strategy — Brussels simultaneously establishes BiCRS implementation as an industrial reform. Specifically: a Brussels Industrial BiCRS Package that keeps machine and CHP production in the Union through a four-pillar approach:
Pillar one — local production requirement. Fifty per cent of BiCRS machines used in EU-funded projects must have demonstrable EU added value of at least fifty per cent (components, assembly and software). Not as a trade barrier but as a financing condition — comparable to European-supplier requirements attached to NGEU funds.
Pillar two — Industrial Acceleration Fund. €15-20 billion channelled through the European Investment Bank into European production facilities for BiCRS machines, ethanol-plant components and micro-CHP units. Focus on the three cluster regions that still have European engineering mass: Bavaria and Baden-Württemberg, northern Italy (Lombardy and Emilia-Romagna), Southeast Brabant and Twente. This is where the mechatronics, engine and pump expertise required for BiCRS machines and CHP units is located.
Pillar three — standard-setting. EU-CEN standardisation for BiCRS injection protocols, ethanol quality and micro-CHP safety. Whoever sets the standard sets the market. Brussels did this successfully with GSM telecommunications in the 1990s and failed to do so with solar panels — the difference is instructive.
Pillar four — binding partner countries. The equatorial supplier countries (the Democratic Republic of the Congo, Indonesia, Brazil, Ghana and Côte d’Ivoire) purchase their BiCRS injection machines through clauses in the framework agreements, mandatorily from EU or partner-country production. No exclusivity (competition between suppliers is allowed), but no Chinese dumping in partner-country markets.
Under this EU strategy, Europe’s share reaches:
EU share of BiCRS machines: 60% (€18 bn/year)
EU share of ethanol plants: 55% (€2.3 bn/year)
EU share of tankers and transport: 25% (€1.1 bn/year)
EU share of micro-CHP units: 80% (€43 bn/year)
The employment effect — what European production concretely delivers
Industrial production generates, on average, five direct jobs per million euros of turnover (assembly, quality control, engineering and R&D) and eight indirect jobs in the supply chain (components, materials, logistics and services). Under an active EU industrial strategy, this produces annually:
BiCRS machines: direct + indirect: 234,000 jobs
Ethanol plants (build-up phase): 29,400 jobs
Tankers and transport: 14,600 jobs
Micro-CHP units (EU steady state): 561,600 jobs
TOTAL EU jobs under strategy: 840,000 jobs
Eight hundred thousand European jobs — approximately three hundred and two thousand of them directly industrial — as the direct consequence of choosing to produce the BiCRS and ethanol chain in Europe rather than import it. In context: this is more than total employment lost in the European automotive industry between 2020 and 2026 (approximately 350,000 jobs according to ACEA), and more than the entire German steel cluster (450,000 jobs).
These are precisely the categories of jobs identified in the current Silent Analysis Brussels as losses: industrial tradespeople in mechatronics, engine engineering, welding, assembly and quality control. Tom — the €52,000 earner from metalworking in Doetinchem who lost his job when the company closed in 2026 — falls exactly into the category that could return to work in a BiCRS machine factory in Twente or a micro-CHP assembly plant in Brabant.
Who coordinates this?
The industrial strategy behind BiCRS and ethanol requires coordination at a level individual member states cannot provide. No Dutch, German or Italian industrial strategy is separately large enough to face China. It must be Brussels’ responsibility, through four channels:
One — DG GROW (Internal Market and Industry). The Directorate-General currently coordinating EU industrial strategy work must make the BiCRS industrial strategy a priority. A Commissioner portfolio for ‘Industrial Climate Components’ should explicitly cover the production of BiCRS machines, ethanol plants and micro-CHP units.
Two — EIB financing. The European Investment Bank should receive a separate BiCRS Industry Facility with €15-20 bn in capital, aimed at establishing factories in the EU. Comparable to the way EIB financing made Airbus possible in the 1970s — now needed for BiCRS machines.
Three — CEN/CENELEC standardisation. European standards organisations must publish BiCRS and ethanol standards within eighteen months. This sounds technocratic but is geopolitically decisive: whoever sets the standard gets the market.
Four — public-private joint ventures. Brussels should facilitate consortia between European agricultural-machinery manufacturers (Claas, John Deere Europe, CNH Industrial, Krone, Same Deutz-Fahr), engine manufacturers (Deutz, MAN, Volvo Penta, Iveco) and ethanol engineering firms (Andritz, Praj-Europe). Not as state aid, but as a competitiveness coalition. The Airbus model applied to agricultural technology.
What the figures say together
BiCRS and ethanol implementation without an industrial strategy is a climate-policy reform that saves Europe climatically while impoverishing it industrially. Brussels pays equatorial partner countries for biomass, pays China for the machines that process the biomass and retains only dependence. It is the worst possible outcome of a good concept.
BiCRS and ethanol implementation with an industrial strategy additionally delivers 840,000 jobs in the Union and €65 billion in annual production turnover within EU borders. It makes Europe a global supplier of climate technology rather than a purchaser of it. It rebuilds industrial mass in the cluster regions hit hardest during the Green Deal period. It keeps the entire benefit of the reform within the Union.
The choice is on the table in the twelve to eighteen months before the first BiCRS implementation decisions. Until then the outcome is uncertain. Afterwards it becomes — as with solar panels and wind turbines — irreversible.
Plastic as long-term above-ground CO₂ storage — the German lignite pits
Alongside BiCRS injection and ethanol production there is a third equatorial biomass application that Brussels has not yet explicitly acknowledged in policy language: plastic. Not as disposable products ending up in the sea, but as a deliberately produced form of carbon storage. And — strategically decisive — with already available storage infrastructure that Europe must dismantle in the course of its climate transition anyway.
“Plastic is a chemical collection of carbon atoms, held together by polymer bonds that do not break down by themselves. It is, by definition, a form of carbon storage. The only question is who acknowledges that we have one.”
— polymer physics, first-order observation
The basic fact — 78 per cent carbon per kilogram
A kilogram of polyethylene, polypropylene or polystyrene consists of approximately 78 per cent carbon. The remainder is hydrogen and trace elements. When this carbon originally comes from equatorial biomass — sugar cane, maize or tropical C4 grasses through the same chain that also produces ethanol — the plastic represents a form of atmospheric CO₂ capture lasting hundreds to thousands of years.
Average carbon fraction of plastic: 78%
Per kg plastic = atmospheric CO₂: 2.86 kg stored
Polymer stability (without combustion): 500-5,000 years
In dry, enclosed conditions: up to 10,000 years
It is important that this is not a theoretical claim. Plastic archaeology shows that plastics from the 1950s — more than seventy years old — remain almost unchanged in dry, enclosed conditions. No measurable carbon degradation has been observed in museum samples of plastic artefacts from seven decades of consumer culture.
Plastic is therefore the only above-ground carbon-storage form whose durability can rival geological storage forms — coal, gas and BiCRS injection. Unlike coal and gas, which work only if they remain underground, plastic remains visible, controllable and immune to the industrial incentive to extract and burn it. There is no economic incentive to recover stored bioplastic.
The German lignite pits — infrastructure waiting to be used
Between 2030 and 2038 Germany will dismantle its three major lignite clusters: Rhineland (RWE — Hambach, Garzweiler II and Inden), Lusatia (LEAG — Welzow-Süd, Jänschwalde, Nochten/Reichwalde) and Central Germany (MIBRAG — Profen/Schleenhain). This includes historic pits in Lusatia that have been closed since 1991 but still have available residual space.
Standard practice — laid down in German mining law — is to fill the pits with groundwater after closure, creating artificial lakes. Lake Hambach would have a surface area of 4,200 hectares and a depth of 411 metres, making it Germany’s largest inland lake, planned for completion around 2080. The question no one in the Bundestag or DG ENER is explicitly asking is: how much better would this be with bioplastic instead of groundwater?
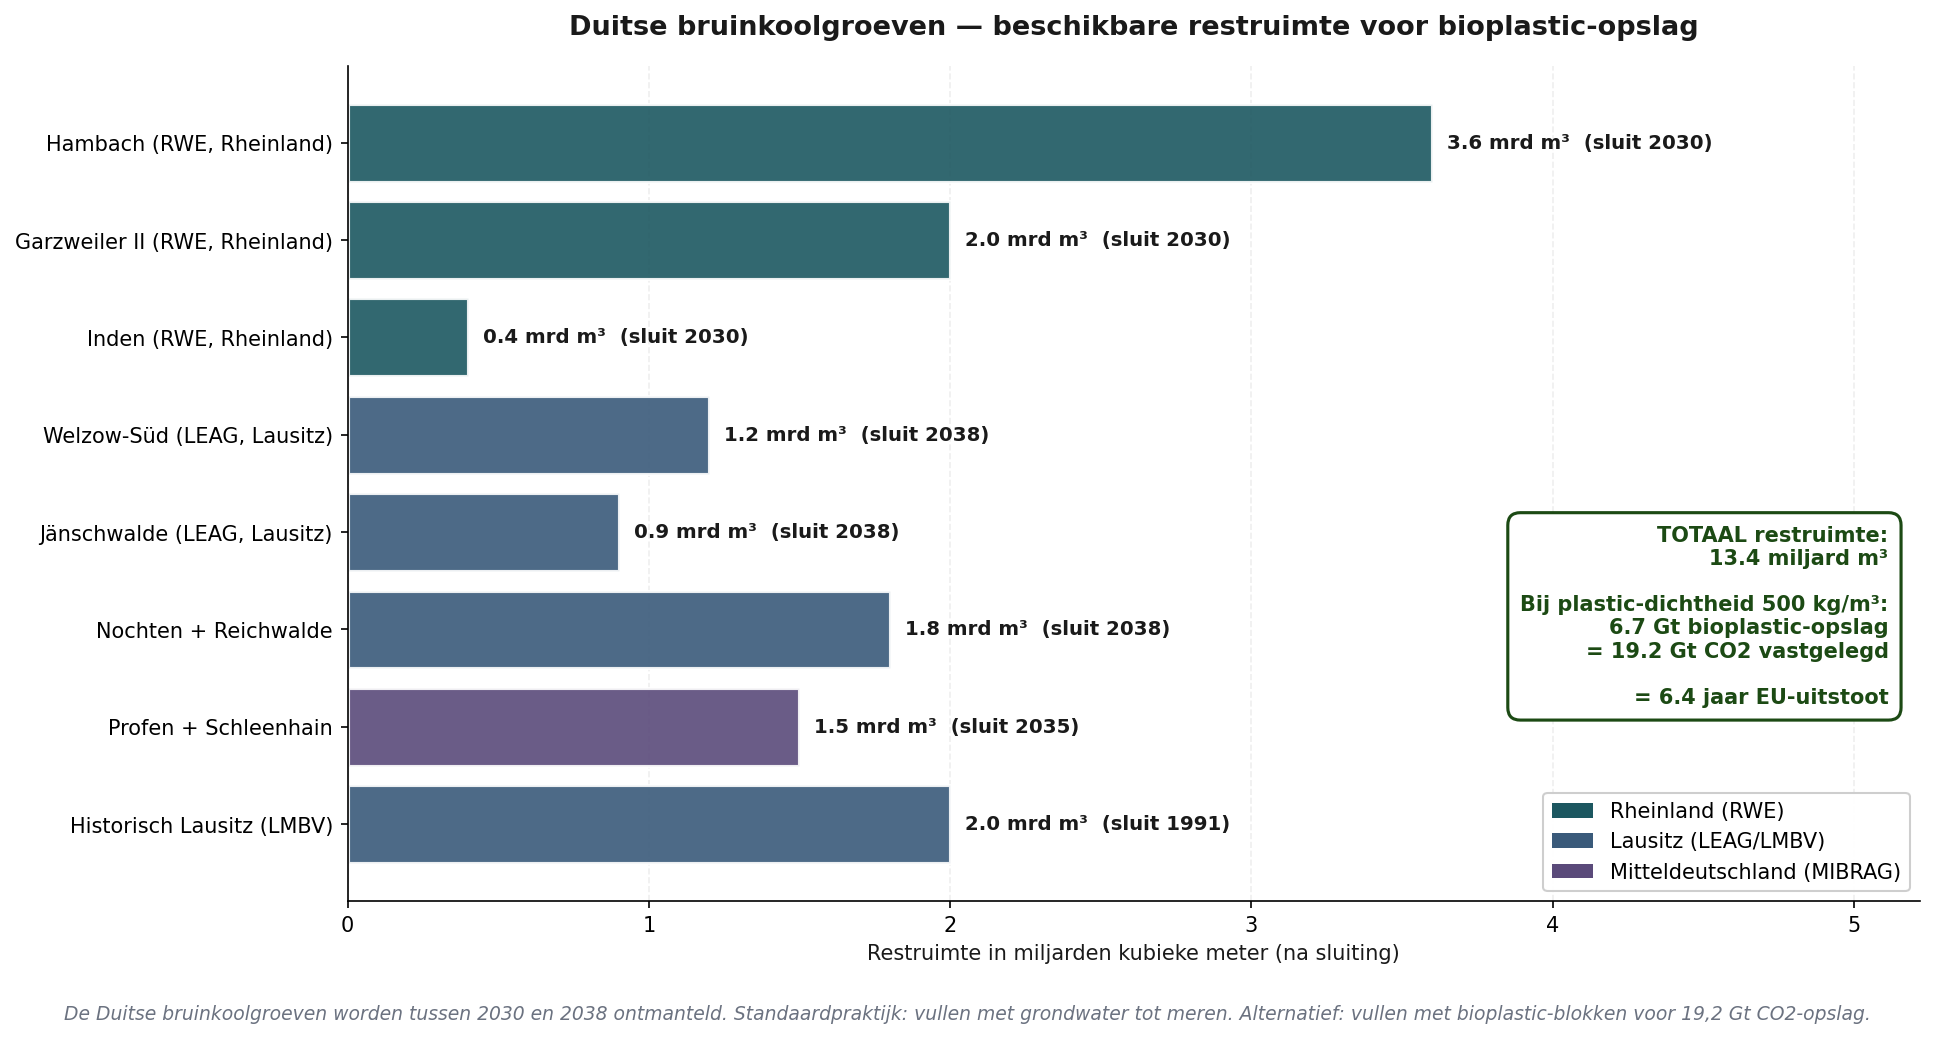
Available residual space in German lignite pits after dismantling. Hambach 3.6 bn m³, Garzweiler 2.0 bn m³, plus the Lusatia and Central Germany clusters. Total 13.4 billion m³ — sufficient for 6.7 billion tonnes of bioplastic storage = 19.2 Gt CO₂ stored.
The figures are substantial:
Total residual space in German lignite pits: 13.4 billion m³
Plastic storage at a density of 500 kg/m³: 6.7 Gt bioplastic
CO₂ equivalent stored: 19.2 Gt CO₂
EU-27 annual emissions 2024: 3.0 Gt CO₂/year
Years of EU emissions the pits can contain: 6.4 years
In other words: the German lignite pits alone — cavities that already exist, infrastructure already financed and sites already out of production — can store more than six years of EU emissions above ground in plastic form. That is not a marginal effect but a strategic climate asset currently unused.
The irony — replacing fossil coal with biogenic plastic
The symbolic power of this reform is difficult to overstate. The cavities created by bringing fossil carbon above ground are filled with biogenic carbon removed from the atmosphere and permanently stored above ground. This is no longer merely a technical reform; it is a direct reversal of the industrial revolution of the past two centuries.
In terms of CRCF certification (Carbon Removals Certification Framework), the storage is verifiable (compressed blocks in dense form and counted tonnages), additional (without this choice the carbon would be burned or never captured) and permanent (polymer stability lasting centuries). Bioplastic in a lignite pit meets the same requirements applicable to biochar and geological CO₂ storage.
The paper illusion — replacing disposable products
A second dimension of the plastic doctrine is counter-intuitive: replace paper with bioplastic, not the other way round. The European Single-Use Plastics Directive 2019 replaced plastic straws, disposable cutlery and plastic cups with paper alternatives. It was intended as an anti-pollution measure; climatically it was a step backwards.
Life-cycle assessment studies after 2021 consistently show that a paper straw emits 8.4 grams of CO₂ in production, compared with 1.5 grams for a plastic straw — six times more. A paper cup emits 110 grams of CO₂ compared with 14 grams for a plastic cup — eight times more. Moreover, paper does not store carbon permanently (paper decomposes within years), whereas bioplastic does (polymer stability lasts centuries).
Ratio: a paper straw produces twenty times more CO₂ than the carbon contained in a plastic straw. At EU scale, fully replacing disposable paper (approximately 5.5 million tonnes per year in the Union) with bioplastic equivalents delivers a net climate benefit of approximately 13 megatonnes of CO₂ per year — plus 16 megatonnes stored in the plastic itself.
The Single-Use Plastics Directive should therefore be revised to distinguish petrochemical disposable plastic (rightly banned because of pollution risk) from biogenic disposable bioplastic with a storage guarantee (climatically positive if captured for long-term storage).
Recycling energy — what we have put into it
In addition to the direct CO₂-balance benefit, there is a second economic effect: the energy Europe currently puts into recycling is largely released when the plastic doctrine is adopted.
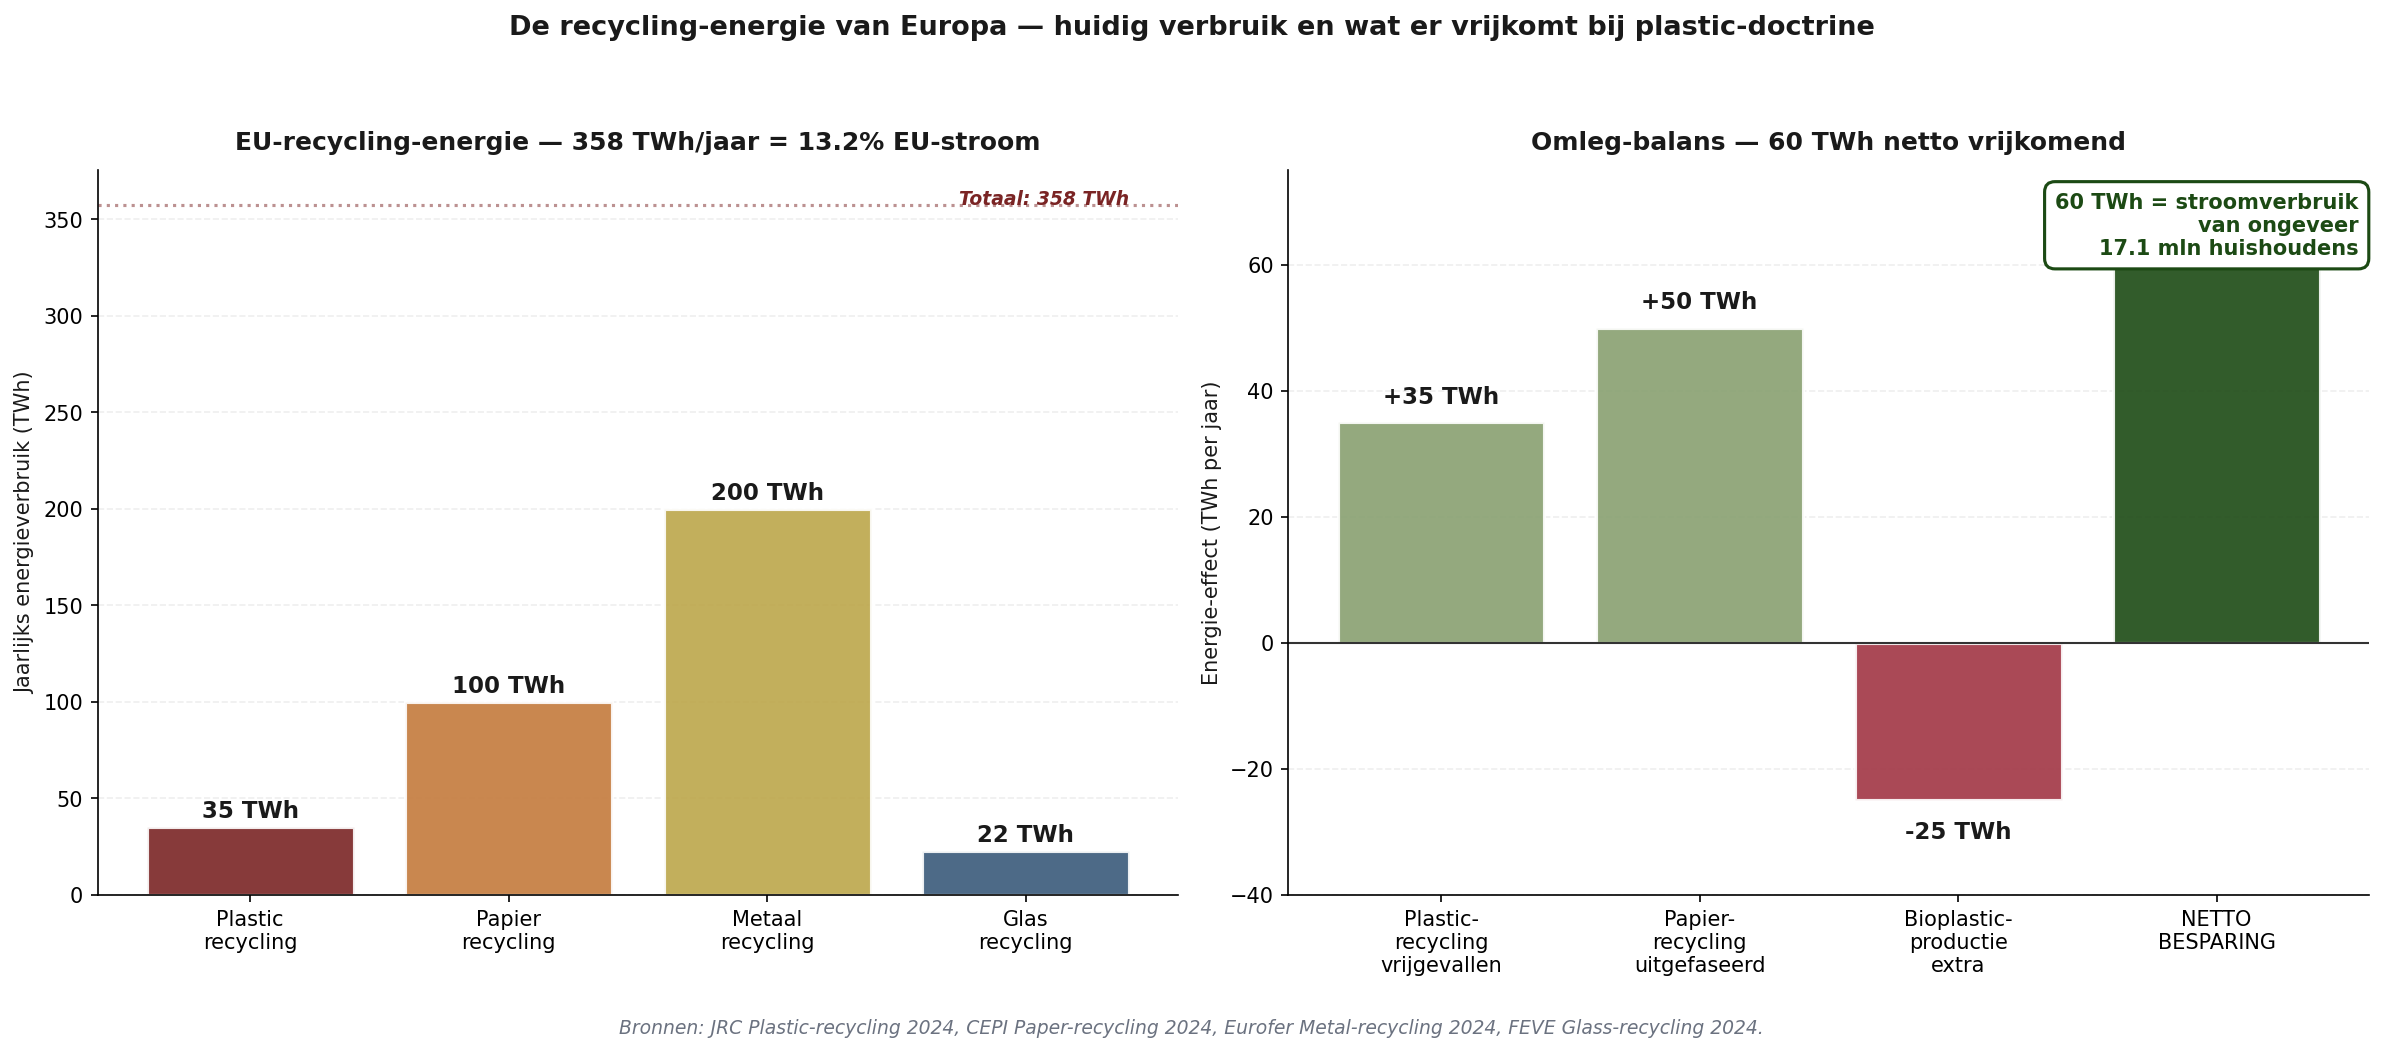
Left: EU energy consumption for recycling is approximately 358 TWh per year — 13 per cent of total EU electricity consumption. Right: shifting to the bioplastic doctrine releases a net 60 TWh per year, equivalent to the electricity consumption of 17 million households.
European recycling uses approximately 358 terawatt-hours of energy every year — 35 TWh for plastic recycling, 100 TWh for paper, 200 TWh for metal and 22 TWh for glass. That is 13 per cent of total EU electricity consumption. Shifting to bioplastic production and phasing out disposable paper releases a net 60 TWh per year — the electricity consumption of approximately 17 million households, or Belgium’s annual consumption.
This 60 TWh can be used for the additional electricity required by CHP rollout, electrolysis for industrial hydrogen (Tata IJmuiden and BASF Ludwigshafen), or green electricity for BiCRS machine production. No more TWh devoted to temporary reuse of short-lived plastic fractions.
Waste incineration — the third plastic sin
European waste-incineration plants are the third area where the plastic doctrine delivers an immediate improvement. The EU currently burns approximately 25 million tonnes of plastic waste per year in incinerators for energy generation. Burning one kilogram of plastic releases 2.86 kg of CO₂ — 71.5 megatonnes of CO₂ per year from the European plastic-incineration fraction. Almost 2.4 per cent of EU emissions.
Incinerators operate at low electrical efficiency (28-32 per cent), compared with modern gas-fired power stations (60 per cent). Plastic combustion therefore produces approximately 3.7 times more CO₂ per kilowatt-hour supplied than the same electricity from gas. Plastic-rich waste-incineration systems are effectively coal-fired power stations under a green label.
In practice: an EU regulation requiring all incinerators to install pre-combustion plastic sorting, with the fraction sent to bioplastic storage or recycling rather than the furnace. The technology is available (near-infrared sorting installations), at a cost of approximately €25-40 m per incinerator, financed from redirected recycling subsidies.
What the plastic doctrine delivers to the EU
Five effects summarised at EU level:
CO₂ stored through bioplastic storage: 143 Mt/year at 50 Mt production
as a percentage of EU emissions: 4.8%
Plastic combustion avoided in incinerators: 71.5 Mt CO₂/year
Paper-substitution emissions avoided: 13 Mt CO₂/year
Total climate effect: ~228 Mt CO₂/year (7.6% of EU emissions)
Recycling energy released: 60 TWh/year
Jobs in EU bioplastic production: ~120,000 (40k direct)
Available storage capacity: 6.4 years of EU emissions
For context: 228 megatonnes of CO₂-equivalent climate effect per year is almost two-thirds of what the current Green Deal package attempts to achieve at EU level — without increasing a single citizen’s energy bill, and while retaining the petrochemical cluster of Rotterdam-Antwerp-Ludwigshafen.
The added value of the plastic doctrine on top of the main track (BiCRS injection) is that production can take place within Europe — it is no longer in-situ injection but a factory economy fitting existing petrochemical clusters. The industrial layer discussed in the previous chapter is therefore not merely preserved but actively strengthened by demand for bioplastic.
The four decisions Brussels must take
One — CRCF recognition of bioplastic storage. The European Carbon Removals Certification Framework must explicitly recognise bioplastic in structured storage as a certified CO₂-removal route. This is a technical update within existing regulation, not a treaty amendment. Time frame: six months.
Two — revision of the Single-Use Plastics Directive. Distinguish petrochemical disposable plastic (rightly restricted) from biogenic disposable bioplastic with a storage guarantee (climate-positive). The current directive should be amended, not replaced. Time frame: twelve months through co-decision.
Three — mandatory plastic sorting at EU incinerators. An EU regulation requiring all waste-incineration plants to sort out the plastic fraction before burning. To be financed from redirected recycling subsidies. Time frame: eighteen months to entry into force.
Four — EU-Germany agreement on lignite-pit redevelopment. The standard practice of filling pits with groundwater should be reconsidered in favour of bioplastic storage. This requires amendment of the German Bundesberggesetz, but falls within existing EU competence for CO₂-storage monitoring. Time frame: 24 months, phased implementation through 2040.
What the figures say together
Plastic from equatorial biomass, stored in existing German lignite pits, forms the third pillar of Brussels’ climate reform — alongside BiCRS injection in equatorial plots and ethanol production for heat and mobility. It is the most visible of the three: a tangible reversal of the industrial revolution, in which holes made by bringing carbon above ground are filled with carbon removed from the atmosphere.
The numerical contribution: 228 megatonnes of CO₂-equivalent climate effect per year (7.6% of EU emissions), 60 TWh of recycling energy released, 120,000 new jobs and storage infrastructure capable of holding six to eight years of EU emissions. All based on existing technology, existing infrastructure and existing European petrochemical clusters.
The plastic doctrine therefore makes the Brussels Consequences Map BiCRS course not only more ambitious climatically, but also stronger industrially and strategically. Unlike BiCRS machines and ethanol plants — which are partly located in Europe and partly in equatorial partner countries — bioplastic production is entirely European. Rotterdam, Antwerp, Geleen, Ludwigshafen, Leuna and Gendorf have the petrochemical infrastructure, engineering expertise and port connections to receive feedstock from the equatorial belt and process it into polymers. The same factories now producing from fossil feedstock can tomorrow produce from biogenic feedstock.
The difference is not in the factory. The difference is where the carbon ends up: in the atmosphere (the current route), or in a German lignite pit for five thousand years (the new route). The choice is technically trivial and politically significant.
Who loses — an honest assessment
No reform is without losers. BiCRS implementation entails shifts that will be painful for specific sectors and regions.
Loser one — existing renewable-energy investments
European investors in wind turbines, solar parks and green-hydrogen projects have invested approximately 1.2 trillion euros over the past fifteen years on the basis of Green Deal subsidies and ETS price expectations. When ETS falls to approximately forty euros per tonne because of BiCRS credit oversupply, part of these portfolios loses value. Mitigation: BiCRS implementation can be rolled out over seven to ten years, with grandfathering of subsidies for existing projects.
Loser two — Brussels climate bureaucracy itself
DG CLIMA, DG ENER and related Directorates-General of the European Commission have expanded substantially in staff and mandate over the past decade — approximately eight thousand employees in total. Under BiCRS their field of operation shrinks dramatically. No Fit-for-55 implementation, CBAM administration or ETS auctions — only supervision of BiCRS implementation, contract monitoring with equatorial suppliers and partnership evaluation.
The Brussels bureaucracy has a vested interest in the continuation of complexity and will naturally resist an instrument that makes it redundant. The reform requires political courage from Commissioners who normally tend to reward the expansion of Directorates-General, not their contraction.
Loser three — fossil-energy-importing countries
Russia and the United States indirectly lose European fossil-energy markets. This is desirable for Russia as part of a post-Ukraine strategy, but for the United States it creates new tension on top of the existing Trump tariffs. A possible consequence is additional US tariffs on European chemicals and industry. The ‘Trump as mirror’ piece (the fifth Consequences Map) already calculated that effect; under BiCRS it is substantially mitigated because European products are already cheaper than their American rivals.
Loser four — the mythical rainforest argument
The first predictable criticism of the BiCRS proposal will be: ‘but then tropical rainforest must be cleared’. The argument sounds strong but collapses under closer examination of the figures.
What one hectare of rainforest actually does
Undisturbed tropical rainforest removes a net two to four tonnes of CO₂ per hectare per year through biomass growth and soil-carbon accumulation. This is the figure used by nature organisations when they say that ‘the rainforest is the lungs of the Earth’. The figure is correct — but it is a fraction of what BiCRS does on the same hectare.
Undisturbed tropical rainforest (CO₂ uptake): 2-4 t CO₂/ha/year
BiCRS in-situ injection on an equivalent hectare: 200 t CO₂/ha/year
BiCRS / rainforest ratio: 50-100× more
And then there is methane
The CO₂ uptake of rainforest is only half the story. Recent scientific research has produced an uncomfortable finding: tropical rainforest is a substantial methane source. Trunks of living tropical trees emit methane through wet bark and internal cavities — Pangala and colleagues estimated in Nature in 2017 that Amazonian tree biomass alone accounts for approximately twenty teragrams of methane per year. Added to this are methane emissions from tropical peat soils (Indonesian peat-swamp forests and the Congo Cuvette peatland) that emit hundreds of kilograms of methane per hectare annually.
Methane has a warming potential — GWP — of twenty-seven to thirty over a hundred-year period, and more than eighty over a twenty-year period according to IPCC AR6. Methane emissions of 0.5 to 1.5 tonnes per hectare per year — the range for tropical rainforest according to current literature — translate into fifteen to forty-five tonnes of CO₂ equivalent per hectare per year on the twenty-year timescale relevant to climate tipping.
The net rainforest balance per hectare per year
CO₂ uptake by biomass and soil: -2 to -4 t CO₂
CH₄ emissions (GWP-20, IPCC AR6): +15 to +45 t CO₂-eq
NET rainforest per ha per year: +13 to +41 t CO₂-eq
NET BiCRS on the same hectare: -200 t CO₂
Climate benefit of BiCRS over rainforest: 213-241 t CO₂-eq
In other words: on the twenty-year timescale, undisturbed tropical rainforest may be a net greenhouse-gas emitter rather than a net sink. This is not an attack on rainforest as an ecosystem — biodiversity, water regulation, local climate regulation and the cultural value of rainforest for indigenous peoples remain valid arguments for its protection. It is an attack on the specific climate argument used to reject BiCRS.
This does not mean the BiCRS programme may expand without limit into rainforest. The practical strategy remains production exclusively on already degraded agricultural land, savannah areas, former oil-palm plantations and derelict industrial zones. Africa alone has approximately four hundred million hectares of degraded agricultural land according to FAO estimates — the European BiCRS portfolio of fourteen million hectares affects less than four per cent of that stock. Independent satellite monitoring through Copernicus and Planet Labs remains crucial to making land-use shifts transparent.
But the climate argument ‘rainforest is sacred because it stores CO₂’ must be scientifically revised. Converting a degraded hectare of savannah in Central Africa to BiCRS production delivers two hundred tonnes of CO₂ removal per year; undisturbed tropical rainforest in the same location delivers four tonnes at best, and in the most realistic case a negative effect on the timescale relevant to climate tipping. The ecological arguments for protecting rainforest remain valid — the climate argument is much weaker than generally assumed.
Implementation — the political roadmap
BiCRS implementation as a replacement for the Green Deal and CBAM requires a majority of Commissioners, a Council decision by qualified majority and EP approval. Not easy, but not unprecedented — comparable to NGEU decision-making in 2020.
2026-2027 — preparation phase
Make the scientific basis publicly available (biomass yields per climate zone, anoxic-permanence studies and the economics of ethanol co-production). Expand initial pilot projects in Ghana (Cape Coast region), Côte d’Ivoire (Yamoussoukro corridor) and Indonesia (Sumatra-Aceh) to a combined capacity of 5 million tonnes of CO₂ per year. Establish independent monitoring infrastructure through Copernicus.
2027-2028 — Commissioners’ proposal and anchor contracts
The next Commission (post-VdL-II, after the 2029 European elections — or earlier in the event of a change of course) presents the BiCRS Package: one regulation easing Green Deal implementation for BiCRS-compliant member states, a new biomass-injection permitting framework for equatorial production and a temporary CBAM suspension for exports to BiCRS-participating countries. Three to four anchor contracts (Ghana, Côte d’Ivoire, Brazil-Pará/Tocantins and Indonesia-Sumatra/Kalimantan) are ratified in this phase — together approximately 5 million hectares, one third of the total portfolio.
2028-2029 — portfolio expansion
The second wave of partner countries is added: the Democratic Republic of the Congo, the Republic of the Congo, Nigeria, Malaysia and the Philippines. The full portfolio of fourteen million hectares is then contracted. Bioethanol distribution takes place through existing fuel networks (Shell, TotalEnergies and ENI). Pillar Two is renegotiated for European flexibility as a parallel track — not as part of BiCRS, but as a logical next step.
2030 — global projection
By 2030 Europe produces 250 Mt of CO₂ removal per year through equatorial suppliers — enough to partially offset EU emissions (approximately 2.5 Gt by then) while building exports of injection services and bioethanol. Global scaling to 185 Mha (1.25 per cent of land area) becomes politically possible once Europe has demonstrated that the system works at forty euros per tonne.
European climate bureaucracy as a drain on prosperity
Before placing the two Consequences Maps side by side, one hard calculation about what is actually at stake. Not the €260 billion per year in Green Deal costs, nor the €477 billion calculated by Bruegel for the 2030 target — those are already internalised in the Consequences Map figures. The issue is the bureaucracy itself that distributes, monitors and evaluates these flows of money.
Together, the European climate bureaucracy comprises approximately 580,000 FTE:
• ~6,000 in the Brussels Commission and agencies (DG CLIMA, the CBAM section of TAXUD, CINEA and the climate EIB)
• ~120,000 in 27 national climate ministries and implementing organisations (RVO, NEa, KfW, ADEME, ENEA)
• ~200,000 in decentralised climate bureaucracy (RESs, climate-protection managers and municipal energy tables)
• ~250,000 in the EU-wide consultancy and compliance industry (Big Four climate practices, NGO staff and engineering firms)
These 580,000 FTE live off the prosperity drain. They produce nothing. They redistribute shrinking incomes through energy prices, insulation mandates, vehicle restrictions, housing constraints and industrial taxes. PwC’s analysis of the Green Deal estimates the annual cost at €260 billion, financed through more than 1,000 different levies. The EU budget for 2021–2027 earmarks €662 billion for climate objectives — 34% of the total, averaging €95 billion per year. Member states add 0.8 to 2.5 per cent of GDP on top of this.
Under BiCRS reform, the raison d’être of the vast majority of these 580,000 FTE disappears. ETS administration becomes superfluous once all carbon removal takes place through one price (€40/tonne) at the equatorial root. CBAM disappears because Europe closes its carbon balance internally. The subsidy implementation layer falls away because technology choice is no longer tied to government. What remains is a small unit setting the single price and checking injection verification — an order of magnitude of 10–20% of the current apparatus.
Against approximately 480,000 released FTE stands the productive employment of the BiCRS chain itself: ~840,000 FTE per year in machine building, maintenance, process operations and international project management. Not as a policy initiative, but as a market response to a working technology at one carbon price.
Germany is most acutely affected. Since 2023, approximately 500,000 FTE have been eliminated in the automotive industry and its suppliers by Chinese EV imports — precisely the sector (precision engineering, hydraulics, fermentation engineering and agri-mechatronics) required by BiCRS implementation. Germany could absorb 250,000–400,000 of the 840,000 chain jobs, provided it is willing to adopt BiCRS instead of maintaining Green Deal+CBAM.
The question is not whether Europe has climate ambitions, but whether it maintains a bureaucratic climate or builds a productive climate. The choice: 580,000 redistributive FTE versus 840,000 productive FTE. Let us instead get to work on producing our own energy.
Brussels’ choice — two Consequences Maps side by side
Open Vizier now publishes two Brussels Consequences Maps. The original shows the price of current policy. This one shows what becomes possible under BiCRS reform. For the European voter they are not contradictory stories — they are two versions of the same calculation under different policy assumptions.
What the original Consequences Map showed:
• An average net loss of 5 to 15 per cent for the European citizen or company by 2030, mainly through the Green Deal and CBAM.
• Industrial relocation of energy-intensive sectors to the US and Asia.
• Brussels as a net impoverisher despite good technical intentions.
What this BiCRS version shows:
• A net difference of 23 to 106 per cent for the European citizen or company by 2030, mainly through in-situ BiCRS injection and the disappearance of Green Deal and CBAM costs.
• Industrial remigration to Europe — without sacrificing a single hectare of European agricultural land. Production is located where the plant grows; the benefit is located where the purchaser lives.
• A new European-equatorial strategic axis as an alternative to dependence on Russian gas and American LNG.
• Brussels as a net benefactor, provided it has the courage to abolish the Green Deal and CBAM in favour of a mechanism achieving the same climate target at one sixth of the cost.
• Industrial capacity kept in European hands: with an active EU industrial strategy, 840,000 jobs and €65 billion in annual turnover remain within the Union — BiCRS machines, ethanol plants, micro-CHP units and bioplastic production. Under the default course this shifts to China, as happened with solar panels and wind turbines.
• The plastic doctrine as a third climate pillar: 228 Mt CO₂ per year (7.6% of EU emissions) stored in bioplastic, 60 TWh of recycling energy released, 120,000 additional jobs and 19.2 Gt of storage capacity in German lignite pits — a buffer for six years of EU emissions.
The summed Brussels outcome
When all reforms are counted together, without double counting, the Brussels Consequences Map BiCRS course produces the following profile:
Net difference for citizen/company 2030: +23 to +106% income equivalent
CO₂ removal through BiCRS injection: 2.8 Gt/year global; €112 bn EU costs
CO₂ storage through bioplastic storage: 228 Mt/year EU (7.6% of emissions)
Recycling energy released: 60 TWh/year (= Belgium’s annual consumption)
Strategic storage capacity in German pits: 19.2 Gt CO₂ = 6.4 years of EU emissions
EU jobs under active industrial strategy: 840,000 BiCRS+ethanol+CHP + 120,000 bioplastic = 960,000
EU production turnover within the Union: €65 bn/year BiCRS chain + €8 bn bioplastic
Time frame to first implementation: 12-24-month decision window
One million jobs, one fifth of European emissions removed or stored, a new strategic axis with the equatorial belt and an industrial layer retained in Europe instead of shifting to China. None of these outcomes requires new technology or new treaties — they require only Brussels’ decision to replace the Green Deal and CBAM with an instrument achieving the same climate target at one sixth of the cost, plus the plastic doctrine shifting petrochemicals from extraction to storage.
“The question for the European voter is not whether climate policy is necessary. It is whether Europe chooses climate policy that destroys its prosperity base, or climate policy that multiplies it. The difference between these two courses is measured in hundreds of billions of euros per year. The technology for the second course is ready — and the plant grows on the equator, not in Brussels.”
— Brussels Consequences Map BiCRS version, closing thought
Methodology and sources
The model uses the same three-step method as the original Brussels Consequences Map (direct wallet effect, macro effect and cascade), with the following changes to the matrix columns:
• Green Deal package (cumulative) — visible in the original matrix; abolished under BiCRS implementation
• CBAM + carbon border adjustment — visible in the original matrix; abolished under BiCRS implementation
• BiCRS replacement column (net difference) — new, added before Nova Democratia. Calculation: BiCRS benefit minus Green Deal costs minus CBAM costs.
• Bioethanol track — separate track with its own hectares, plants and contract model; not included in the BiCRS benefit calculation in this piece
Scientific basis for the calculation:
• Anoxic biomass conservation: natural peat-formation studies show 80-95% carbon retention over centuries under oxygen-free conditions (Limpens et al., Biogeosciences 2008; Page et al., Nature 2011 on tropical peat). Liquefied biomass through cell disruption can be distributed more evenly than solid biomass, allowing the anoxic environment to become homogeneous more quickly and minimising oxidative edge zones.
• Biomass carbon fractions of 46-48% in plant dry matter (US Department of Energy BETO 2019).
• Root mass 25% of plant CO₂, permanently in soil at 0-2m depth (Jackson et al., Nature 2017 on soil-carbon distribution).
• Methane emissions from tropical rainforest: Pangala et al., Nature 2017 (‘Large emissions from floodplain trees close the Amazon methane budget’) estimates approximately 20 Tg CH₄/year from Amazon tree trunks alone, alongside comparable emissions from tropical peatlands in the Congo Cuvette and Indonesia (Dargie et al., Nature 2017; Page et al., Nature 2011). GWP values for methane: IPCC AR6 WG1 Chapter 7 (2021): GWP-100 = 27-30, GWP-20 = 81-83.
• Net carbon balance of tropical rainforest: Pan et al., Science 2011 (‘A Large and Persistent Carbon Sink in the World’s Forests’) for the uptake side; Brienen et al., Nature 2015 on weakening of the Amazon sink (-30% decline 1990-2010); Mitchard, Nature 2018 for revised tropical sink estimates.
• Bioethanol from lignocellulose 197-470 L/tonne biomass, production costs approaching €0.20/litre at scale (NREL Process Design 2015; IEA Bioenergy Task 39 cost reduction studies 2020).
• Equatorial biomass yields of 250-600 tonnes fresh/ha/year for tropical C4 grasses (Pennisetum, Miscanthus tropicalis and Napier) under optimal conditions (FAO Tropical Biomass Production Survey 2019).
Sources for the Brussels status quo 2026:
• EU ETS price June 2026: €78/tonne (Investing.com ICE EUA futures)
• CBAM implementation 2026: €82/tonne effective import tariff (EU Commission CBAM monitoring)
• Total Fit-for-55 implementation costs 4-6% of EU GDP (DG CLIMA Impact Assessment 2024)
The Excel model with all 20 BiCRS scenario functions and the difference calculation will be made available at eu-bicrs.openvizier.org when the platform goes live.
Limitation: as with all Consequences Maps, the matrix shows the cumulative effect per column under the assumption that that mechanism is dominant. In practice, a household experiences the combined effect with overlap between mechanisms. The matrix is a map of potential sources of influence, not a guaranteed total.
WRITTEN BY JACOBUS VAN MERKSTEIJN WITH EDITORIAL AI SUPPORT
OPEN VIZIER — OPENVIZIER.ORG
THE CONSEQUENCES MAP SERIES — GEVOLGENKAART.NL • KONSEQUENZKARTE.DE • KONSEGWENZI.MT • EU.GEVOLGENKAART.NL • TRUMP-SPIEGEL.OPENVIZIER.ORG • EU-BICRS.OPENVIZIER.ORG
JUNE 2026
WRITTEN BY JACOBUS VAN MERKSTEIJN WITH EDITORIAL AI SUPPORT
OPEN VIZIER · OPENVIZIER.ORG · JUNE 2026