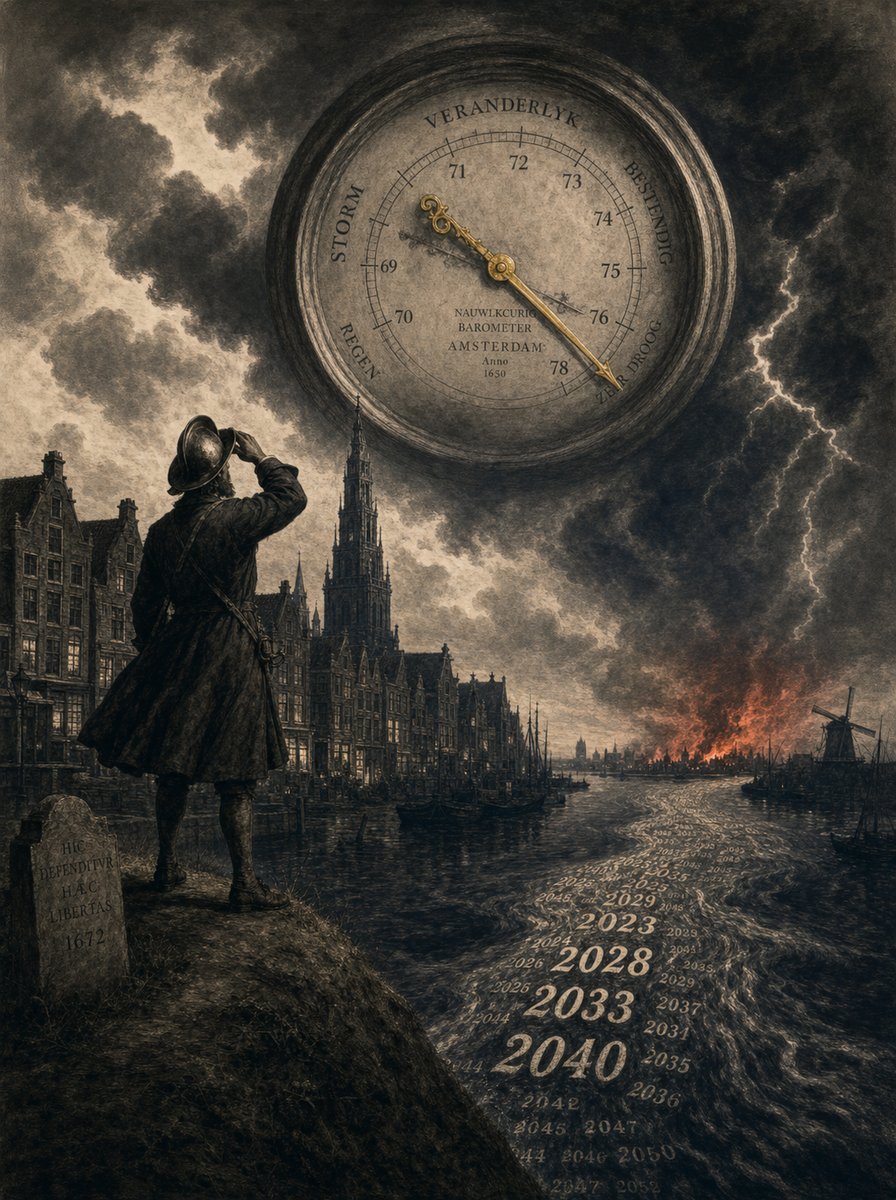
The Dutch Revolution
Forecast 2028-2055 — deduced from five historical collapse patterns, adjusted for the actual debt position, calibrated against the German curve.
Jacobus van Merksteijn
- Author --- Jacobus van Merksteijn
- Date --- 18 July 2026, Palma, Mallorca
- Section --- Political-economic forecast · Edition 2 (Tax policy) · with German and French parallels
- Sources --- Statistics Netherlands (CBS) Government Finances, March 2026, DNB June 2026, 2026 Budget Memorandum, Bundesbank March 2026, German Federal Ministry of Finance DBP 2026, Bruegel October 2025, Stiftung Marktwirtschaft, OECD PISA 2022, World Bank GDP per capita, Skocpol (1979), Goldstone (1991), personal eyewitness observations from France, July 2026
- Method --- Four-phase model from political sociology, curve analysis of Russia/South Africa/Argentina/Venezuela, adjustment of the Dutch debt ratio for GDP imputations, comparative analysis of Germany
The Dutch revolution is coming. Not as an armed struggle, but as a system implosion: a series of overlapping crises between 2032 and 2035 that will break the current political and economic order. What follows is 10–15 years of chaos dominated by a predatory elite, followed by authoritarian stabilisation under a new leader. Dutch prosperity will fall to 45–50% of its 2020 level at the low point in 2040, recovering to 65–70% by 2055. Industry will largely disappear. France will get there three to five years earlier. The Netherlands and Germany are on the same fiscal trajectory and will probably go down simultaneously. The earlier reassurance that we occupied a separate buffer position is obsolete in accounting terms.
The hidden debt — why it will happen sooner than admitted
Before you examine the pattern, you need to know where the Netherlands really stands fiscally. The officially communicated figure systematically conceals reality. This is not rhetoric. It is accounting.
At the end of 2025, the Netherlands has government debt of €524 billion, equivalent to 44.4% of official GDP. Statistics Netherlands, DNB, the Ministry of Finance and the Budget Memorandum all repeat this position as evidence that the Netherlands remains comfortably below the European reference value of 60% — fiscally disciplined, in order. That is the message received by the House of Representatives, heard by rating agencies, believed by investors and quoted by the newspapers.
The debt ratio is a fraction: debt divided by GDP. If you artificially inflate the denominator, the ratio appears lower than it really is. The Netherlands does this systematically through four accounting constructs that together produce approximately €108 billion, or around 9.2%, in artificial GDP:
- Imputed rent — Statistics Netherlands calculates what 4.6 million homeowners “hypothetically” pay themselves in rent and adds this to GDP. There is no transaction, no income and no taxable amount. Contribution: ~€60 billion.
- Pass-through via shell companies (SPEs) — multinational profits flow through the Netherlands without jobs or genuine production, but still count towards GDP under ESA 2010. Contribution: ~€25 billion.
- Capitalisation of R&D since 2013 — R&D is no longer recorded as a cost but as an investment. This increased Dutch GDP by ~2.5% as a one-off adjustment. Contribution: ~€15 billion.
- Other imputations (FISIM, government at cost) — banking services and government services are counted at cost, not at market value. Contribution: ~€8 billion.
Subtract these items, and approximately €985 billion of productive economic base remains. Add the obligations already committed for the next five years (Climate Fund €30bn, Nitrogen Fund €25bn, TenneT and EBN loans €40bn, grid reinforcement €60bn, military pension funding €8bn, raising defence spending to 2% of GDP cumulatively €50bn, healthcare shortfall €80bn, Groningen €20bn — total €313bn), and the debt moves towards €837 billion.
€837 billion divided by €985 billion is 85%. That is France’s phase-2 end-state, not phase 1.
| Calculation | € billion | Debt ratio |
|---|---|---|
| Official: debt / official GDP | 524 / 1,180 | 44.4% |
| Correction 1: less artificial GDP elements | 524 / 1,072 | 48.9% |
| Correction 2: less government overhead without productive value | 524 / 985 | 53.2% |
| Correction 3: plus obligations committed for the next 5 years | 650 / 985 | 66.0% |
| Corporate accounting: plus implicit pension obligations | ~3,000 / 985 | ~305% |
The realistic Dutch debt ratio is 65–66%, not 44%. If we apply corporate accounting as companies are required to do — including implicit pension obligations under IFRS — debt exceeds 300% of GDP. Worse than France officially. Worse than Italy. Worse than Belgium. The fact that the government still speaks of “fiscal headroom” is not because that headroom exists, but because it is politically untenable to say that it has gone.
The Netherlands and Germany — the same trajectory, different rhetoric
Under the adjusted figures, the Netherlands and Germany are on the same fiscal trajectory. The difference is that Germany openly admits this and the Netherlands does not.
| Metric | The Netherlands | Germany |
|---|---|---|
| Officially communicated 2025 | 44.4% of GDP | 63.5% of GDP |
| Actual (adjusted) | 65–66% | 68% (2026 EC forecast) |
| 2028 forecast | ~70–75% | 76.5% (German Ministry of Finance) |
| 2037 forecast | ~85% (extrapolation) | 85% (IW Cologne) |
| Implicit pension obligations | ~250% of GDP | 391% of GDP (Stiftung Marktwirtschaft) |
| Total sustainability gap | ~300% | 454% of GDP (€19.5 trillion) |
| Long-term convergence (Bruegel) | ~100% | ~100% |
In March 2025, Germany did something historically unprecedented: it amended the constitutional debt brake. A €500 billion infrastructure fund was created outside the budget for twelve years. Defence spending above 1% of GDP was exempted from the debt brake. The Länder were once again allowed to incur debt equivalent to 0.35% of GDP. The German Ministry of Finance projects the debt ratio at 76.5% in 2028. IW Cologne puts it at 85% in 2037. The Bundesbank expects the ratio to fall below 60% only in the mid-2050s.
Germany has made a political choice: better to admit now that the fiscal rules no longer work than to muddle through with artificially low figures. The Netherlands has not made that choice. We continue to communicate the 44% message while reality stands at 65%. The consequence: German investors, pension funds and journalists know where they stand. They plan on the basis of real figures. Dutch investors, pension funds and journalists will be caught by surprise when the true position becomes visible — probably in 2027–2029, when the increase in defence spending, the Climate Fund and TenneT loans all hit the balance sheet at once.
The Netherlands has no separate buffer position. We are not fiscally stronger than Germany. We are simply less honest.
Four countries, one trajectory
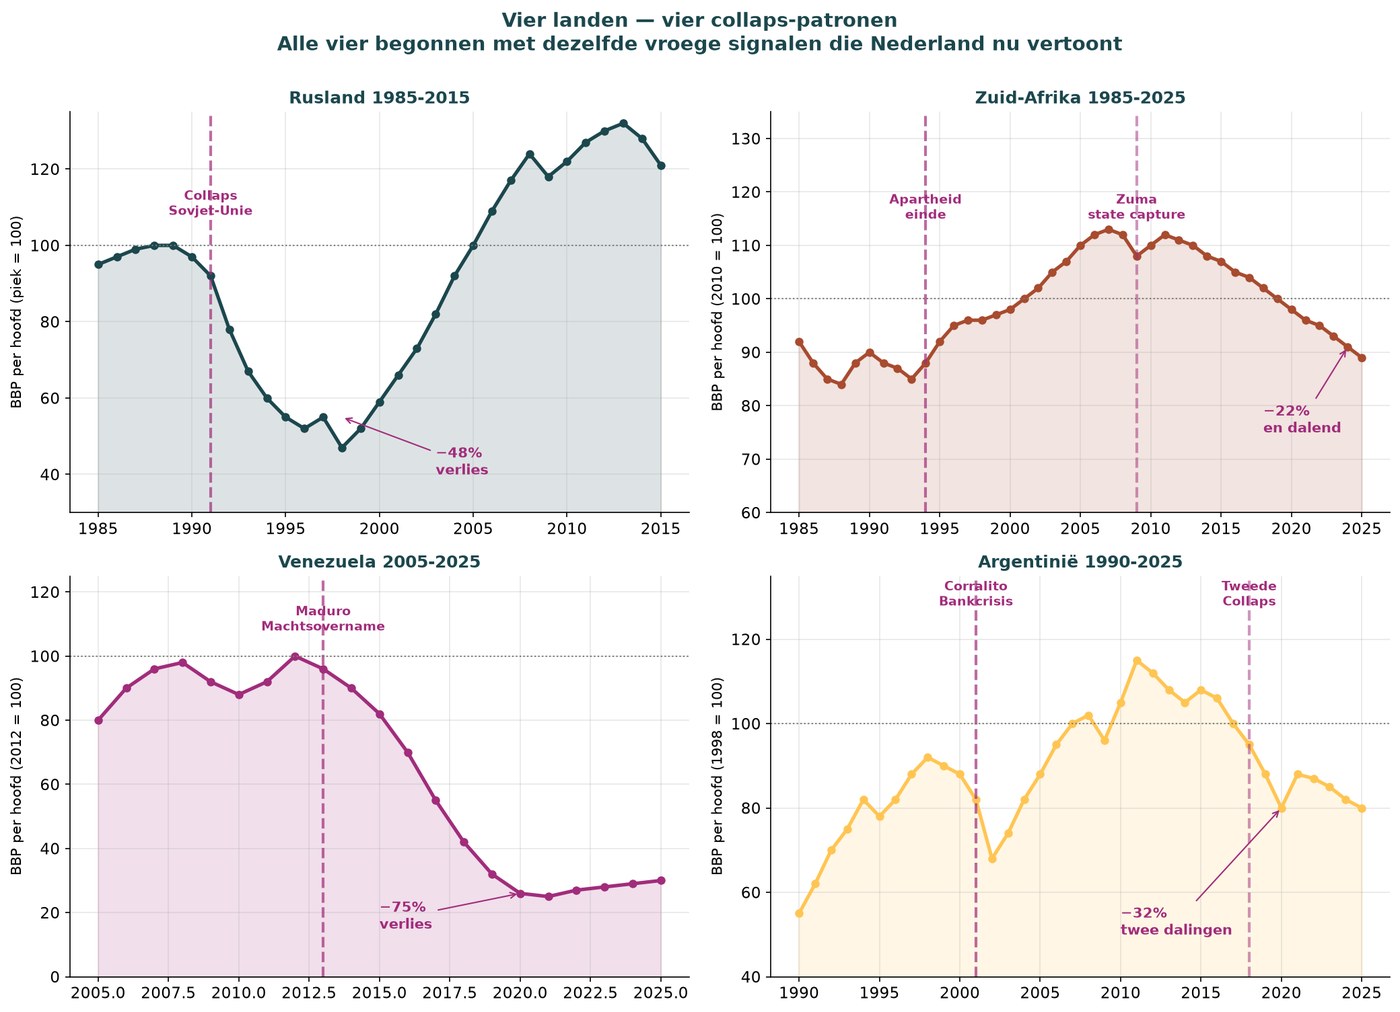
Every modern collapse in prosperity follows the same trajectory. Russia lost 48% of GDP per capita between 1989 and 1998 — nine years of continuous decline after the Soviet implosion. South Africa has fallen by 22% since 2010, and the decline is accelerating. Venezuela lost 75% in ten years under Chávez and Maduro. Argentina lost 32% between 1998 and 2002, partially recovered and has been falling again since 2018.
This is not theory. These are official World Bank and IMF figures from four different continents and five decades. Countries that developed the early warning signs all lost between 30% and 75% of their prosperity within 10–15 years. There is no known case in which the early warning signs developed and the subsequent collapse failed to occur.
France is the fifth. Anyone travelling through France in July 2026 will see the late-phase-2 signals that will become visible in the Netherlands around 2029–2031. I have been there myself.
I was in France. It is closer to the brink there than in the Netherlands, I fear. I saw Champagne — the entire economy there is collapsing because people are no longer drinking champagne, as other sparkling wines have improved in quality and are much cheaper. Then I went south, to expensive restaurants placing bottles of mineral water on the table with the caps removed, filled with foul-smelling tap water. The terrace boards were loose — there was no money to screw them back in. A complete disaster. I cut my trip short and hurried home, whereupon I came down with diarrhoea from the food.
This anecdote appears personal. It is diagnostic. Tap water in branded bottles is a broken contract between provider and customer, exactly as we saw in Argentina in 2001, Greece in 2011, Venezuela in 2015 and South Africa in 2018. Loose terrace boards are entrepreneurs who no longer have the capital for maintenance. A collapsing Champagne industry is a national luxury sector losing its core customers to cheaper alternatives — the British whisky crisis of the 1980s repeating itself in the south of France.
French government debt officially stands at 112% of GDP, and in reality at approximately 140% after corrections. Two prime ministers have fallen over budgets in twelve months. More than 1,000 French mayors have resigned under fiscal pressure since 2020. The French Socialists are making a 2% wealth tax on assets above €100 million a condition of joining the government. French industry lost 30% of its jobs between 2000 and 2020. Since 2022, the Assemblée Nationale has had no clear majority. The €10 billion in Gilets Jaunes concessions made in 2018–19 did not remove the discontent; they merely placated it.
When France enters phase 3, the Netherlands will be pulled along more rapidly through three channels. Dutch banks (ING, Rabobank) hold French government bonds — a French default would mean a Dutch banking crisis within six to twelve months. France is the third-largest destination for Dutch exports — a French recession would mean 8–12% fewer Dutch exports. Every ECB policy intervention operates across the eurozone — higher interest on Dutch government debt, pressure on ABN and ING, and a freeze in the housing market.
You went to France as a tourist and saw what French entrepreneurs have already been experiencing for two years.
Six early warning signs — all present in the Netherlands
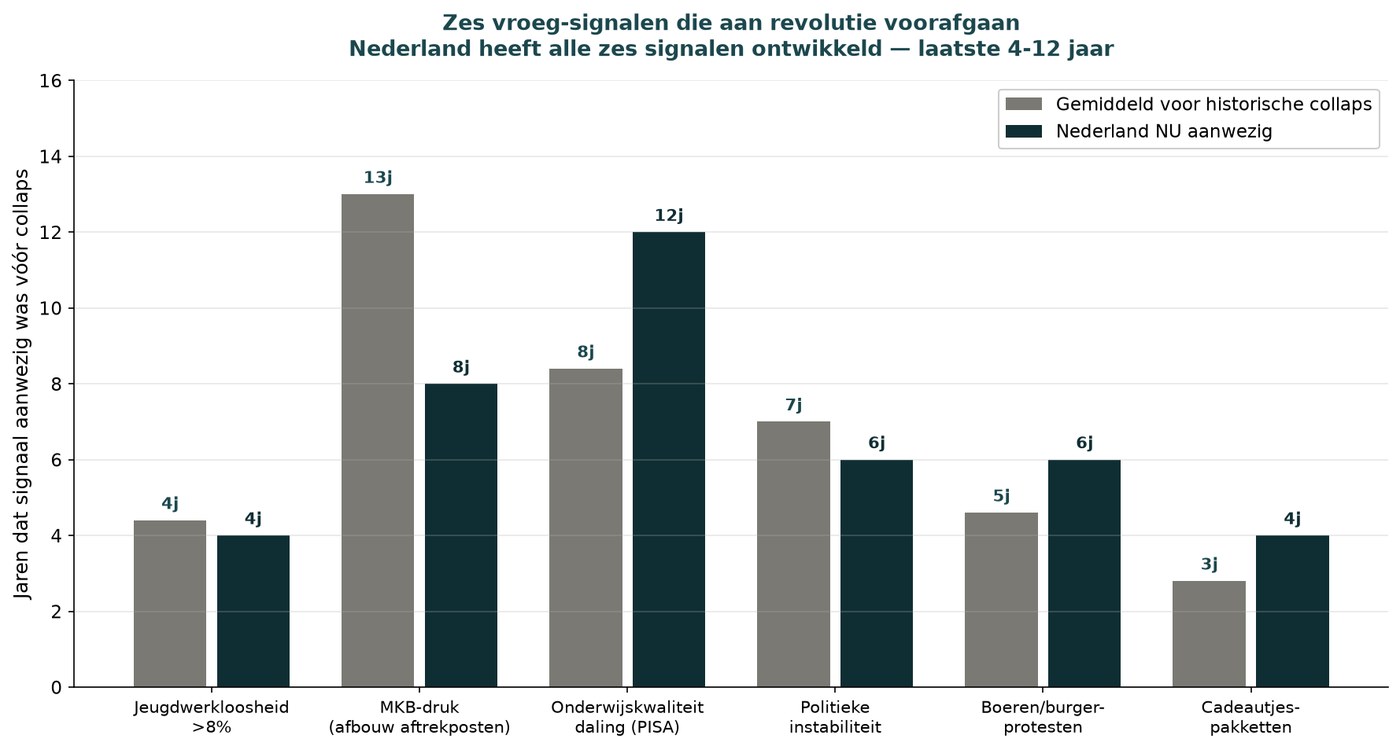
Political sociology (Skocpol, Tilly, Goldstone) has identified six early warning signs that precede every systemic collapse. The Netherlands has all of them, and two have been present longer than the historical average:
| Sign | Status in the Netherlands | Average before historical collapse |
|---|---|---|
| Youth unemployment above 8% | Present for 4 years (9.3% Jan 2026) | 4.4 years before collapse |
| SME pressure (withdrawal of tax deductions) | Present for 8 years | 13 years before collapse |
| Declining educational quality | Present for 12 years (PISA since 2014) | 8.4 years before collapse |
| Political instability | Present for 6 years (Rutte III government fell in 2021) | 7 years before collapse |
| Farmers’/citizens’ protests | Present for 6 years (nitrogen policy since 2019) | 4.6 years before collapse |
| Giveaway packages | Present for 4 years (€25 billion Nitrogen Fund in 2022) | 2.8 years before collapse |
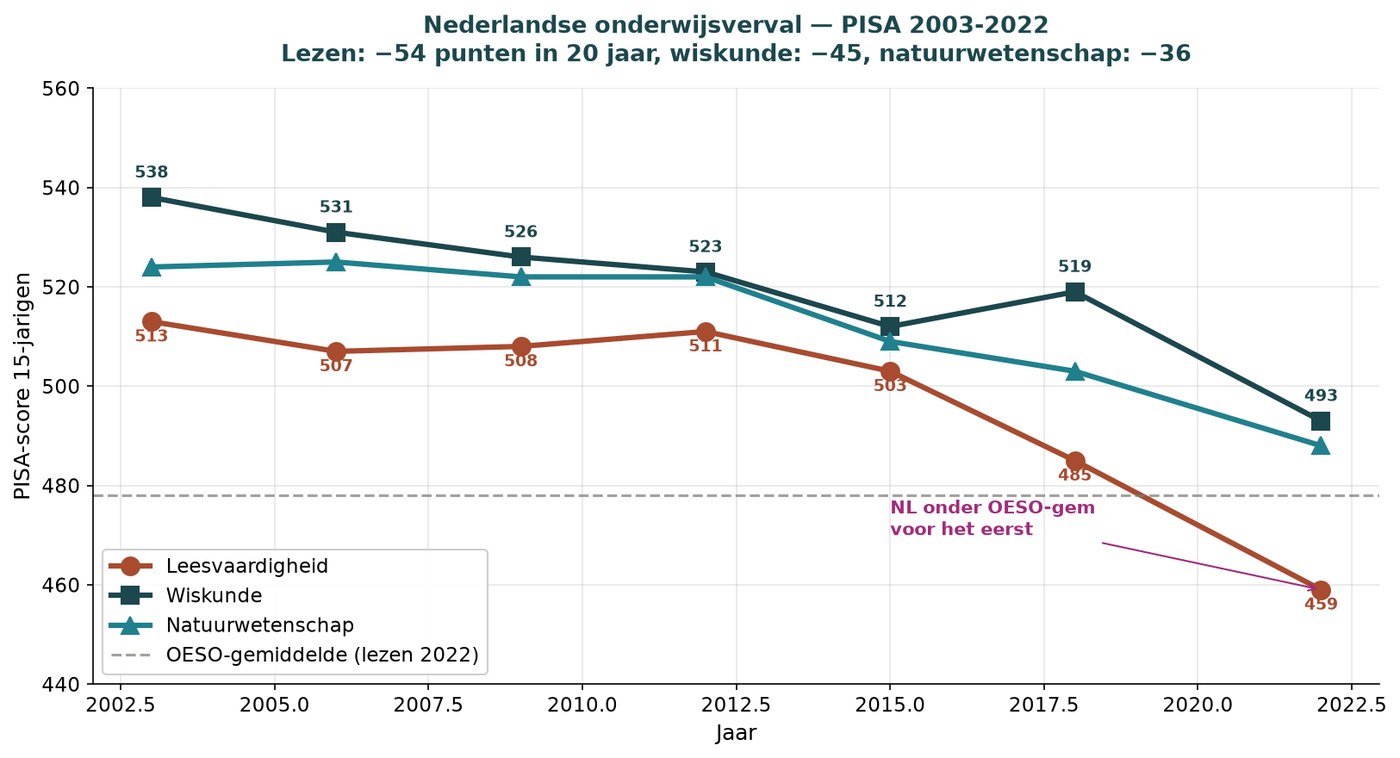
The Netherlands is further advanced than the table initially suggests. Education is at the heart of all this. In 2003, the Netherlands was a global education leader (PISA reading 513, mathematics 538). By 2022, it had fallen below the OECD average in reading proficiency (459). Of the fourteen EU countries that have participated in PISA since 2006, only Greece scores lower. 33% of fifteen-year-olds leave school insufficiently literate. In 2015, the figure was 18%. This is the generation that will be aged between 25 and 35 in 2035 — precisely the age at which revolutionary discontent becomes politically manifest.
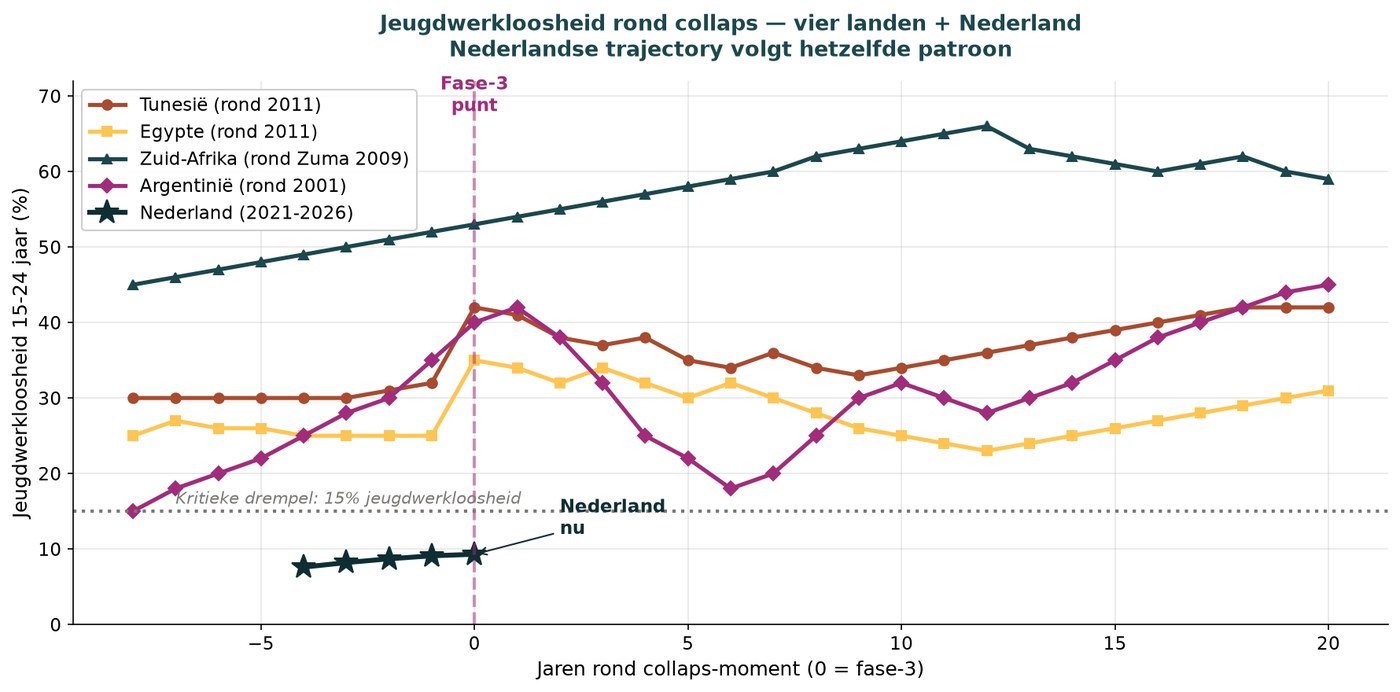
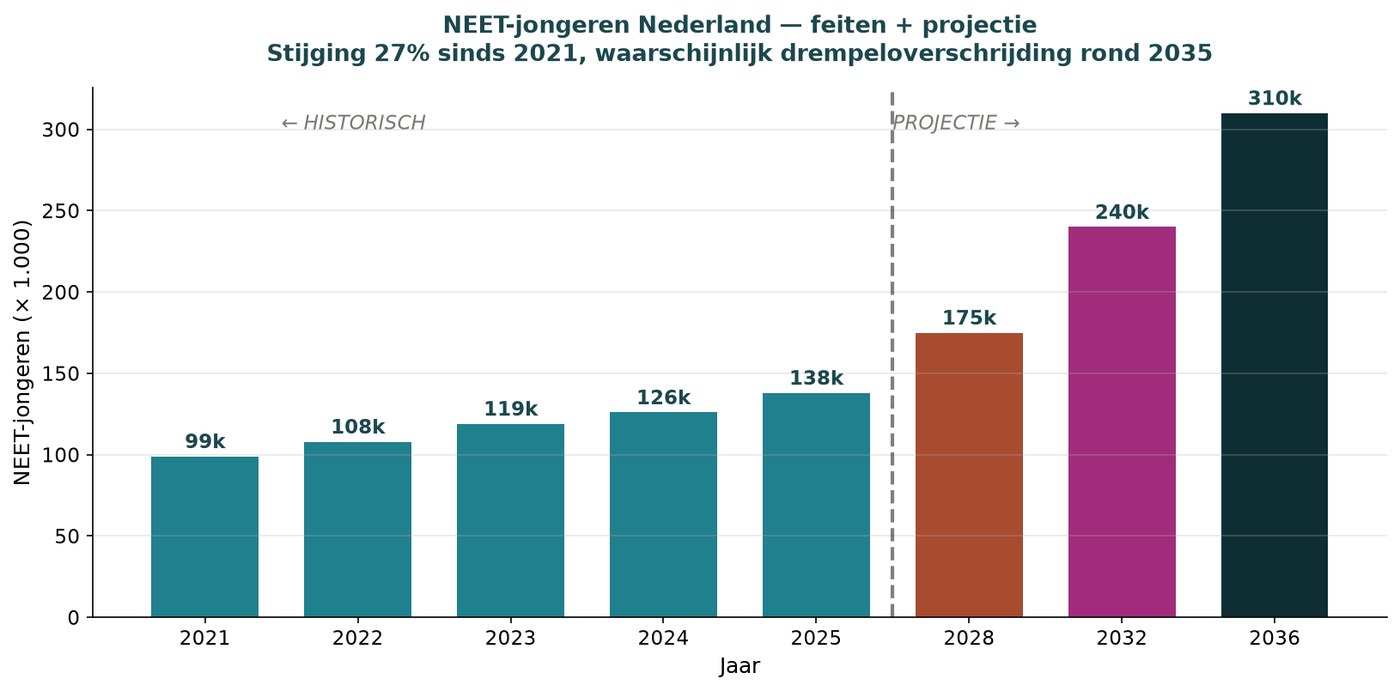
NEETs (not in employment, education or training): 99,000 in 2021, 126,000 in 2024. More than half are not actively seeking work. This is the core group that has historically driven every revolution. France in 1789 had the sans-culottes. Russia in 1917 had demobilised soldiers. Egypt in 2011 had a “generation without a future”. The Netherlands now has 126,000 NEETs, with 300,000 on the horizon by 2036.
The timeline — when exactly
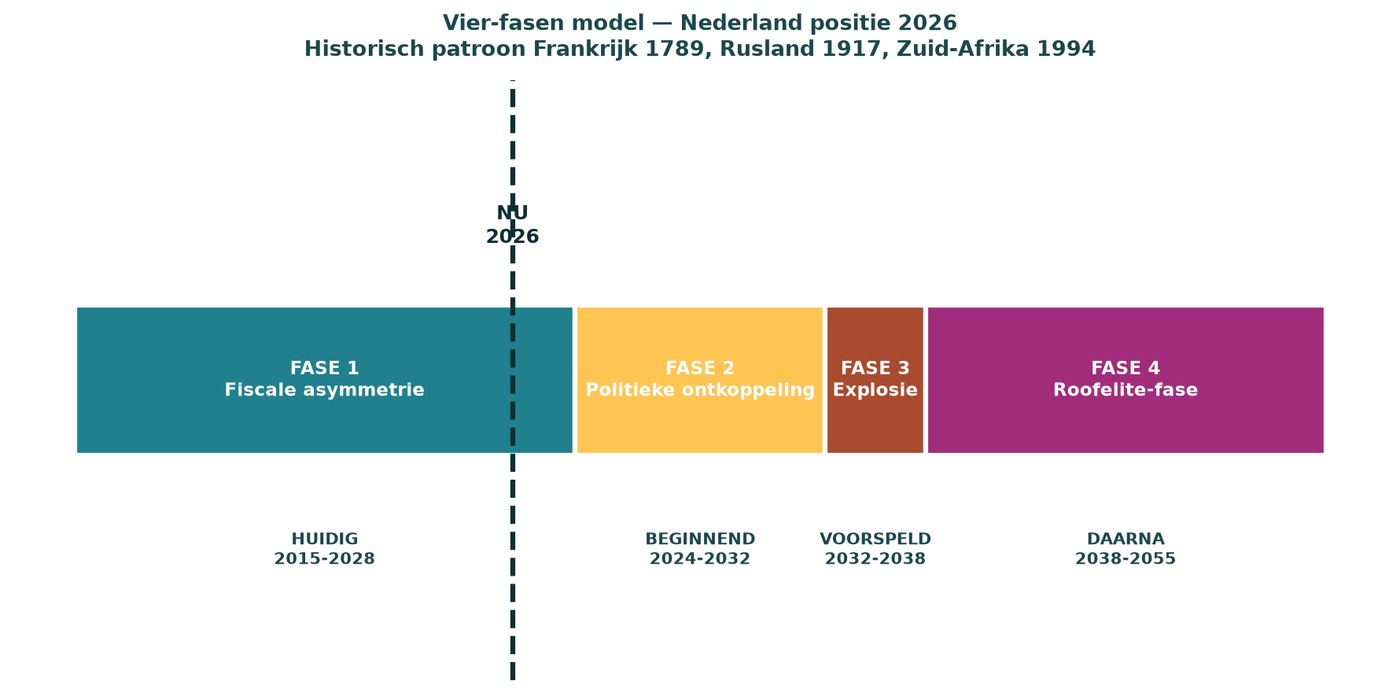
2026–2028: current phase
Further withdrawal of SME tax deductions (the self-employed tax allowance falling to €900 in 2027). CSRD reporting becomes mandatory for medium-sized companies. Energy prices rise as a result of higher ETS costs and the expansion of CBAM. The French phase 3 is drawing closer; France’s creditworthiness is declining. Dutch elections in 2027–2028: PVV/BBB/JA21/FVD form a larger bloc than the current coalition. The Netherlands and Germany both reach an actual debt ratio of 70%.
2028–2031: acceleration
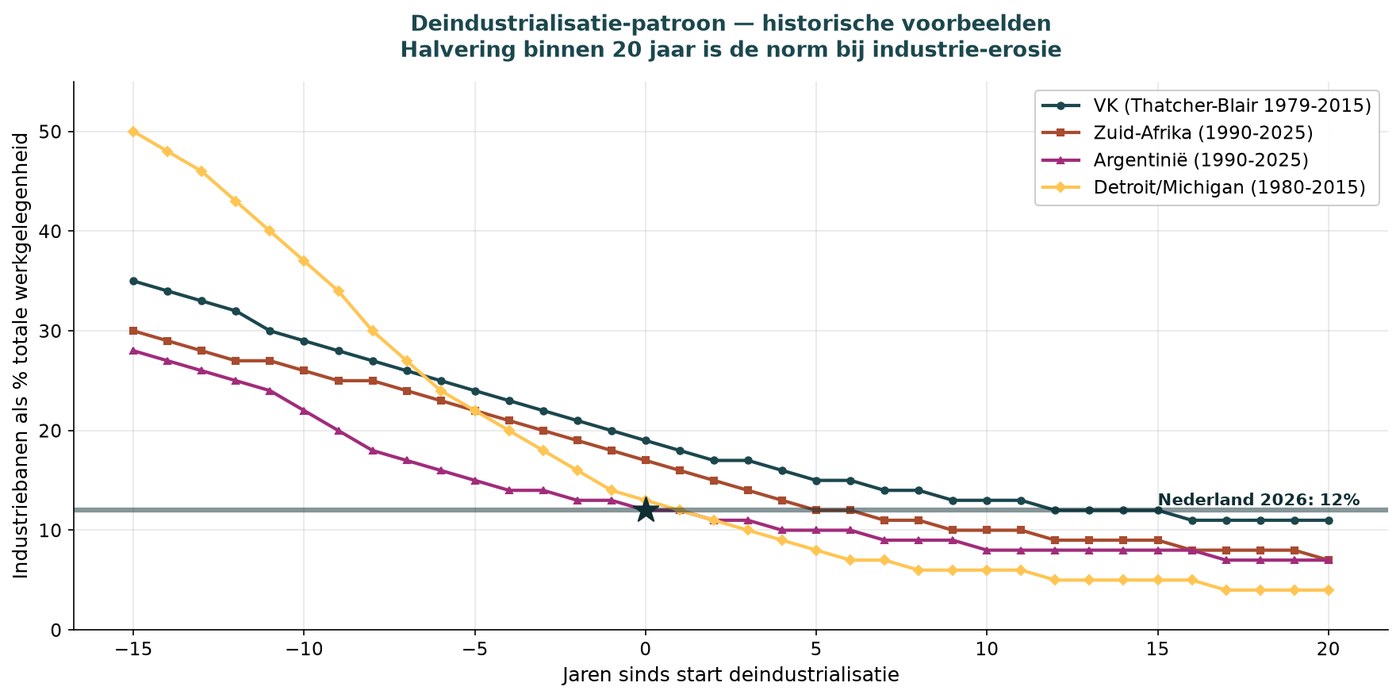
French phase-three explosion (bank/currency crisis or mass unrest). EU Green Deal programmes come under pressure because of budgetary problems. Tata Steel closes in 2027–2029, with 11,000 jobs lost. German deindustrialisation escalates (BASF, VW, ThyssenKrupp). Dutch exports fall by 15 to 20%. Youth unemployment rises to 12 to 14%. The number of NEET young people rises to 175,000–200,000.
2031–2033: rising tensions
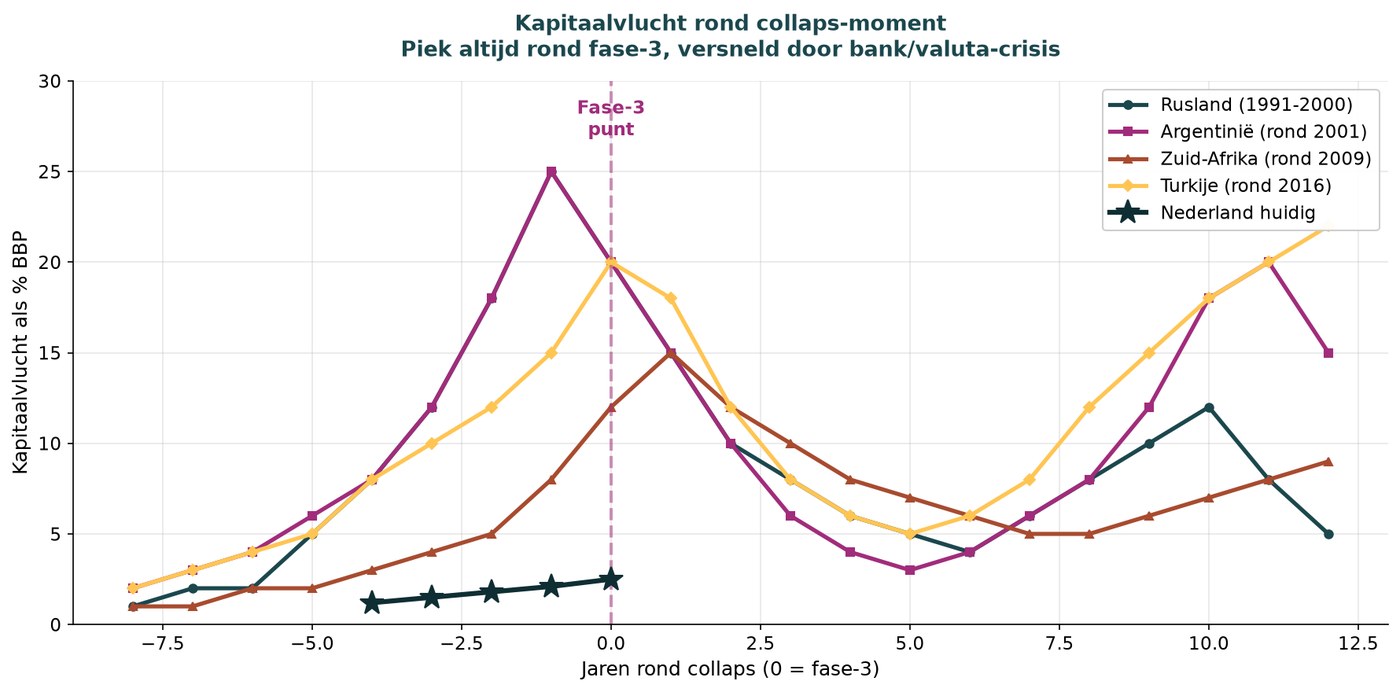
First major demonstrations in Dutch cities, possibly including occupations. First “giveaway package” à la Gilets Jaunes: €15–20 billion — but the government has no fiscal room left. Pension funds come under pressure, with the first cuts. Capital flight accelerates. Budget crisis: a choice between raising taxes or imposing cuts. The housing market freezes.
2032–2035: phase-three explosion
Most likely year: 2033–2034. The trigger is, by definition, unpredictable in form but predictable within a time window. Most likely: an energy crisis (blackouts, gas at €5/m³ as during the Gilets Jaunes protests in 2018), an immigration-related incident (an attack, village annexation as in Southport 2024), or a banking crisis (a major Dutch bank contaminated by a French default, as in Ireland in 2008 and Cyprus in 2013). Less likely but possible: a new tax increase on the middle class, farmers’ blockades causing food shortages in cities, or the political assassination of a prominent figure.
The Dutch curve — 2015–2055
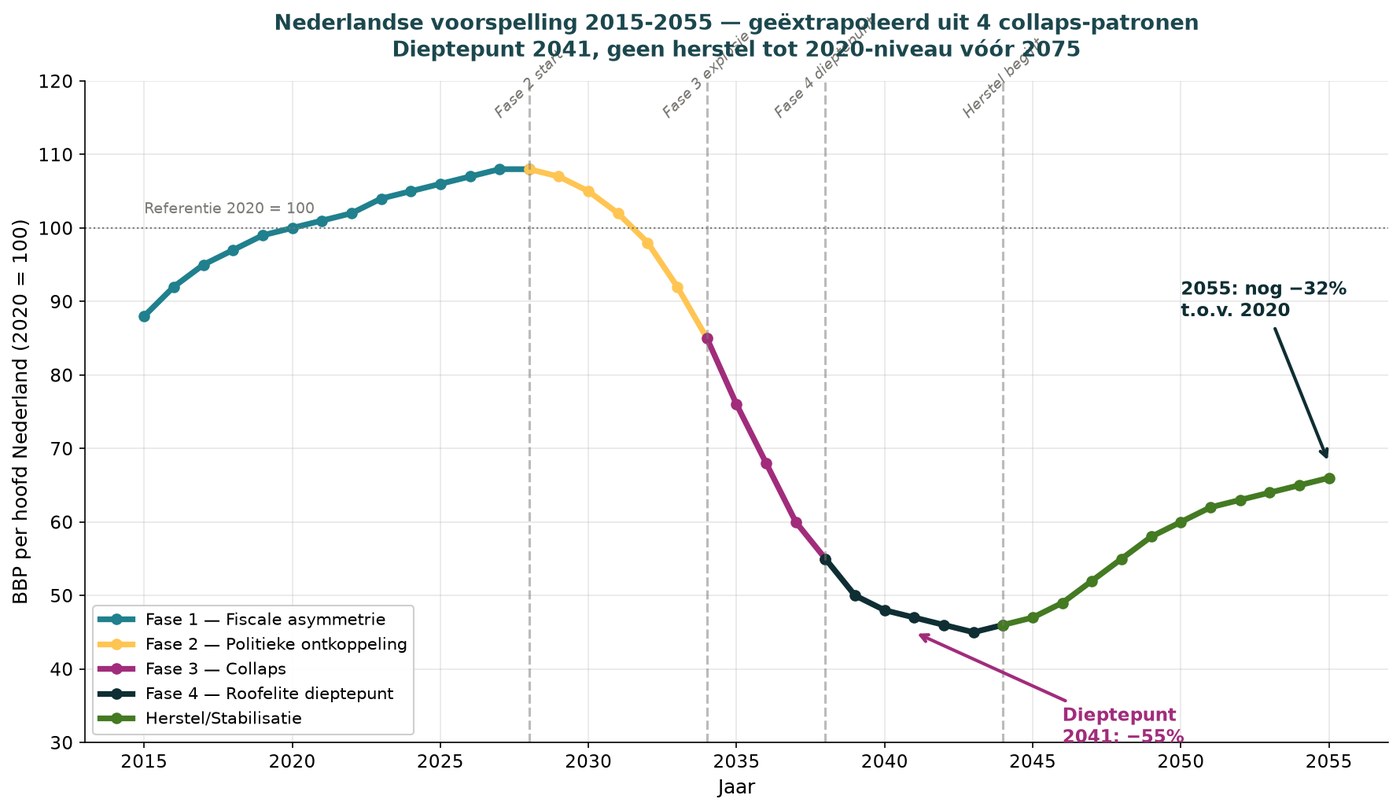
Drawing on the curves of four historical countries and the six early warning signs, we derive the Dutch trajectory:
| Period | GDP p.c. (2020=100) | What happens |
|---|---|---|
| 2015–2020 | 88–100 | Growth phase, prosperity increases |
| 2020–2028 | 100–107 | Peak, phase-one tensions beneath the surface |
| 2028–2032 | 107 → 90 | Phase-two acceleration: unrest, cabinet collapse, contraction |
| 2032–2036 | 90 → 55 | Phase-three collapse: banking/currency crisis, industry collapses |
| 2036–2044 | 55 → 45 → 49 | Phase-four low point: predatory elite consolidates power, chaos |
| 2044–2055 | 49 → 68 | Slow stabilisation under new (authoritarian) leadership |
Low point: 2040, with GDP per capita at 45% of the 2020 level. The Netherlands will then be at Romania’s 2015 level of prosperity. For ordinary Dutch people, this means: pensions halved, homes worthless, industrial jobs gone, children emigrated, universities provincial.
Who is affected, and how severely
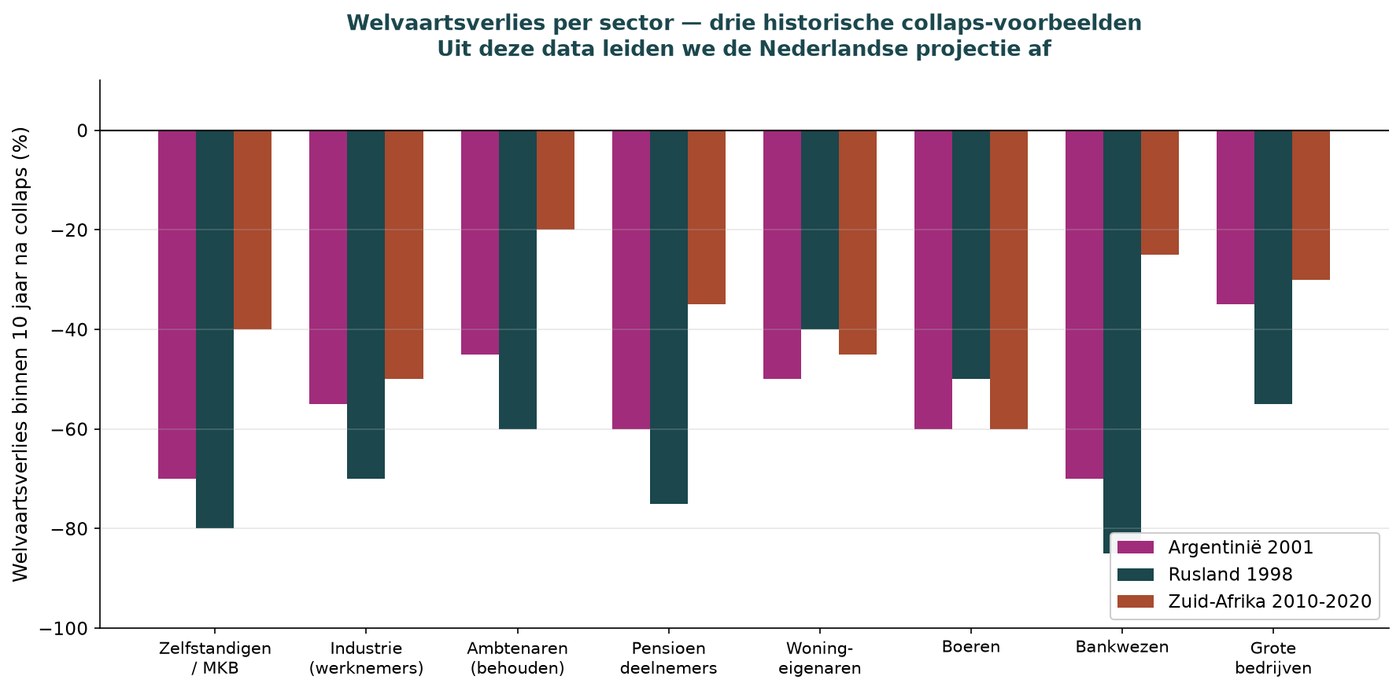
From Argentina in 2001, Russia in 1998 and South Africa from 2010 to 2020, we know the distribution of losses in prosperity across sectors. The Netherlands will follow a comparable pattern:
| Group | Predicted loss | Precedent |
|---|---|---|
| SME owners | −80% | Argentina −70%, Russia −80% |
| Banking sector (shareholders) | −75% | Russia −85%, Iceland 2008 −90% |
| Farmers + horticulturalists | −70% | South Africa −60%, Argentina −60% |
| Pension funds (members) | −65% | Russia −75%, Argentina −60% |
| Homeowners | −55% | South Africa −45%, Argentina −50% |
| Large companies’ Dutch divisions | −50% | Russia −55%, Argentina −35% |
| Civil servants (those retained) | −45% | Argentina −45%, South Africa −20% |
| Benefit recipients | −40% | Argentina −40%, South Africa −30% |
The “winners” of phase 4 are not the same as today’s winners. Historically, a new class emerges at the top: Anglo-Saxon private equity firms (Blackstone, KKR, Carlyle) buying up Dutch industry for 5 to 15% of its value; former senior civil servants moving into banking and consultancy through old networks; crypto-wealth holders who moved their assets outside the Dutch tax net early enough; foreign strategic investors (China, Saudi Arabia, the US) taking over ports, technology and energy infrastructure; organised crime taking over dispute resolution — Rotterdam and Amsterdam South-East already have early examples; and, ultimately, a populist-authoritarian political leader promising “order” — compare Putin in 2000, Orbán in 2010 and Erdoğan in 2003.
The writer, and the decision he has already made
I myself moved to Mallorca and Malta to live among the wealthy. There, I am poor among the rich. I feel safer there. I know what lynching is. You will no longer see me in France.
I am not writing this as a prophet advising others what to do while remaining in place himself. I did the calculations, examined the historical patterns, saw the French reality with my own eyes — and acted on that basis. Two locations on the EU periphery where authoritarian-stable regimes, low taxation, warm climates and international communities exist.
“Poor among the rich” is historically informal. In Argentina in 2001, wealth moved to northern Buenos Aires. In South Africa from 2015 to 2020, it moved to southern Cape Town, Portugal and Malta. In Venezuela from 2015 to the present, it moved to Miami and Panama. The pattern is always the same: move to a community where your wealth is low in the local context but high in the context you left behind. “I know what lynching is” is not rhetoric. This is the sentence South African farmers use when explaining why they are moving to Portugal. It is what happens during phase 3 and early phase 4, when the police can no longer guarantee the rule of law.
What you can do now
As an individual
- Children — send them to Germany, Switzerland or the US for their studies. Arrange a second EU nationality before 2032.
- Assets — diversify outside the Netherlands. Switzerland, Singapore, Luxembourg. Physical precious metals.
- Property — sell your second home now and reduce the mortgage on your first home as far as possible.
- Business — sell at the current value if you are over 55. Under 55: internationalise your customer base.
- Skills — invest in crisis-resistant skills: healthcare, engineering, agriculture and crafts.
- Network — build an international network. In-country networks become less valuable during phase 3.
As someone politically engaged
- Support the system-reversal proposal (CO2 certificate at source, flat tax, SME protection).
- Ask politicians explicitly: “what is your plan for the scenario of a collapse in prosperity?” No one has one at present.
- Publish the figures. Public awareness is the most powerful antibiotic against phase 3.
- Join MKB-Nederland. VNO-NCW is too entangled with multinational interests.
As a journalist or publisher
- Publish the PISA figures, the NEET trend, the fiscal asymmetry and the hidden debt ratio of 65%.
- Avoid the word “revolution” in headlines — it will be dismissed as extremism. Use “system crisis”.
- Publish one concrete event each week that confirms the pattern.
- Never force your own conclusion — let the reader assemble the puzzle themselves.
Concluding statement
The Dutch revolution is coming. Not as an armed struggle, but as a system implosion. This prediction has been brought forward by two to three years compared with earlier versions, because the actual Dutch debt ratio appears to be 65% — not the officially communicated 44%. The Netherlands and Germany are on the same fiscal curve; the difference is that Germany openly acknowledges this and the Netherlands does not. In a French crisis, both countries will be dragged along simultaneously.
There is one alternative: radical, rapid, gradual system reversal — a CO2 certificate at source, a single-rate flat tax, SME protection and withdrawal from Brussels’ regulatory burden. This is the “gradual exit” that will work only if it is implemented within the next three to five years. After 2028–2029, that window will be closed.
Those who read this prediction and still do nothing are implicitly choosing the scenario. Those who act can still break the pattern. The choice is now.
What is solid and what is uncertain
Historical patterns (France, Russia, South Africa, Argentina, Venezuela) can be empirically verified through the World Bank, the IMF and Maddison. Dutch early warning signs are based on official CBS, OECD and Eurostat data. The four-phase model is a consensus in political sociology. The 65% debt ratio can be verified through public CBS methodology and Budget Memorandum sources. Germany’s fiscal position is officially known through the Bundesbank and the German Ministry of Finance. The final phase of France’s phase 2 is directly observable in banking and political crisis data.
What is uncertain is the precise timing (phase 3 could come in 2031 or 2036, not exactly 2033–2034), the nature of the trigger (unpredictable in form, only within a time window), the response of the EU and NATO (external stabilisation could divert the pattern), the quality of political leadership during the crisis (which could shorten or prolong the chaos), and any unforeseen technological breakthroughs (AI, energy, biotech).
Uncertainty does not mean improbability. Insurance is based on patterns such as these. If a country has followed a comparable trajectory five to seven times in the last 240 years, and the Netherlands is showing measurable early warning signs, preparing for the possibility is a rational choice.
If this prediction does not come true — because system reversal is implemented, an external factor diverts the pattern, or people read this and act — then the prediction will have done its job. If this prediction does come true, be prepared. And remember: there were warnings.
Related reading
- They already know. And they are doing nothing. — the climate-parallel piece about the same administrative paralysis
- Deciding without prospects — GDP lies — the earlier version of the debt calculation, now updated to 65%
- Edition 2 — Tax policy — the broader fiscal framework
- Germany Edition — why Germany’s curve is also our curve