The blown-out front door of the Netherlands
While the Netherlands counts itself among the happiest countries in the world, it ranks at the bottom of a 35-country ranking of feeling base. Switzerland: 61.3. The Netherlands: 3.4. This is what that means.
The Open Visor · analysis based on Model V17 (35 countries · 4 mid-functions · 2000–2025)

Somewhere on an ordinary Dutch street, another front door is blown out of its frame tonight. The residents often do not know why. The neighbors say it was quiet. The municipality announces a camera plan. The newspaper reports it under “the underworld”. And the country carries on with what it does best: publishing figures on life satisfaction, winning happiness rankings, and reassuring itself that everything is fine.
The blown-out front door is not the problem. It is the symptom. What the Netherlands does not see is that the base behind that door — the shared feeling layer on which a society rests — has been becoming quieter, smoother and thinner for two decades already. And that the country, measured against that same base, now ranks at the bottom of a list of thirty-five countries. Below the United States. Below Canada. Below France. Far below Germany. And at a distance from Switzerland, which ranks first.
The shock in one graph
Model V17 measures four so-called mid-functions per country: spatial-bodily (RLG), boundary-and-feeling (GGG), moral-structural (MSG) and authority-trust (HVG). Together they form the feeling base of a society — the layer on which judgment, attachment and public morality later rest. Each country receives a score from 0 to 100, averaged across the four axes. The 35 countries studied are ordered from highest to lowest score in 2025.
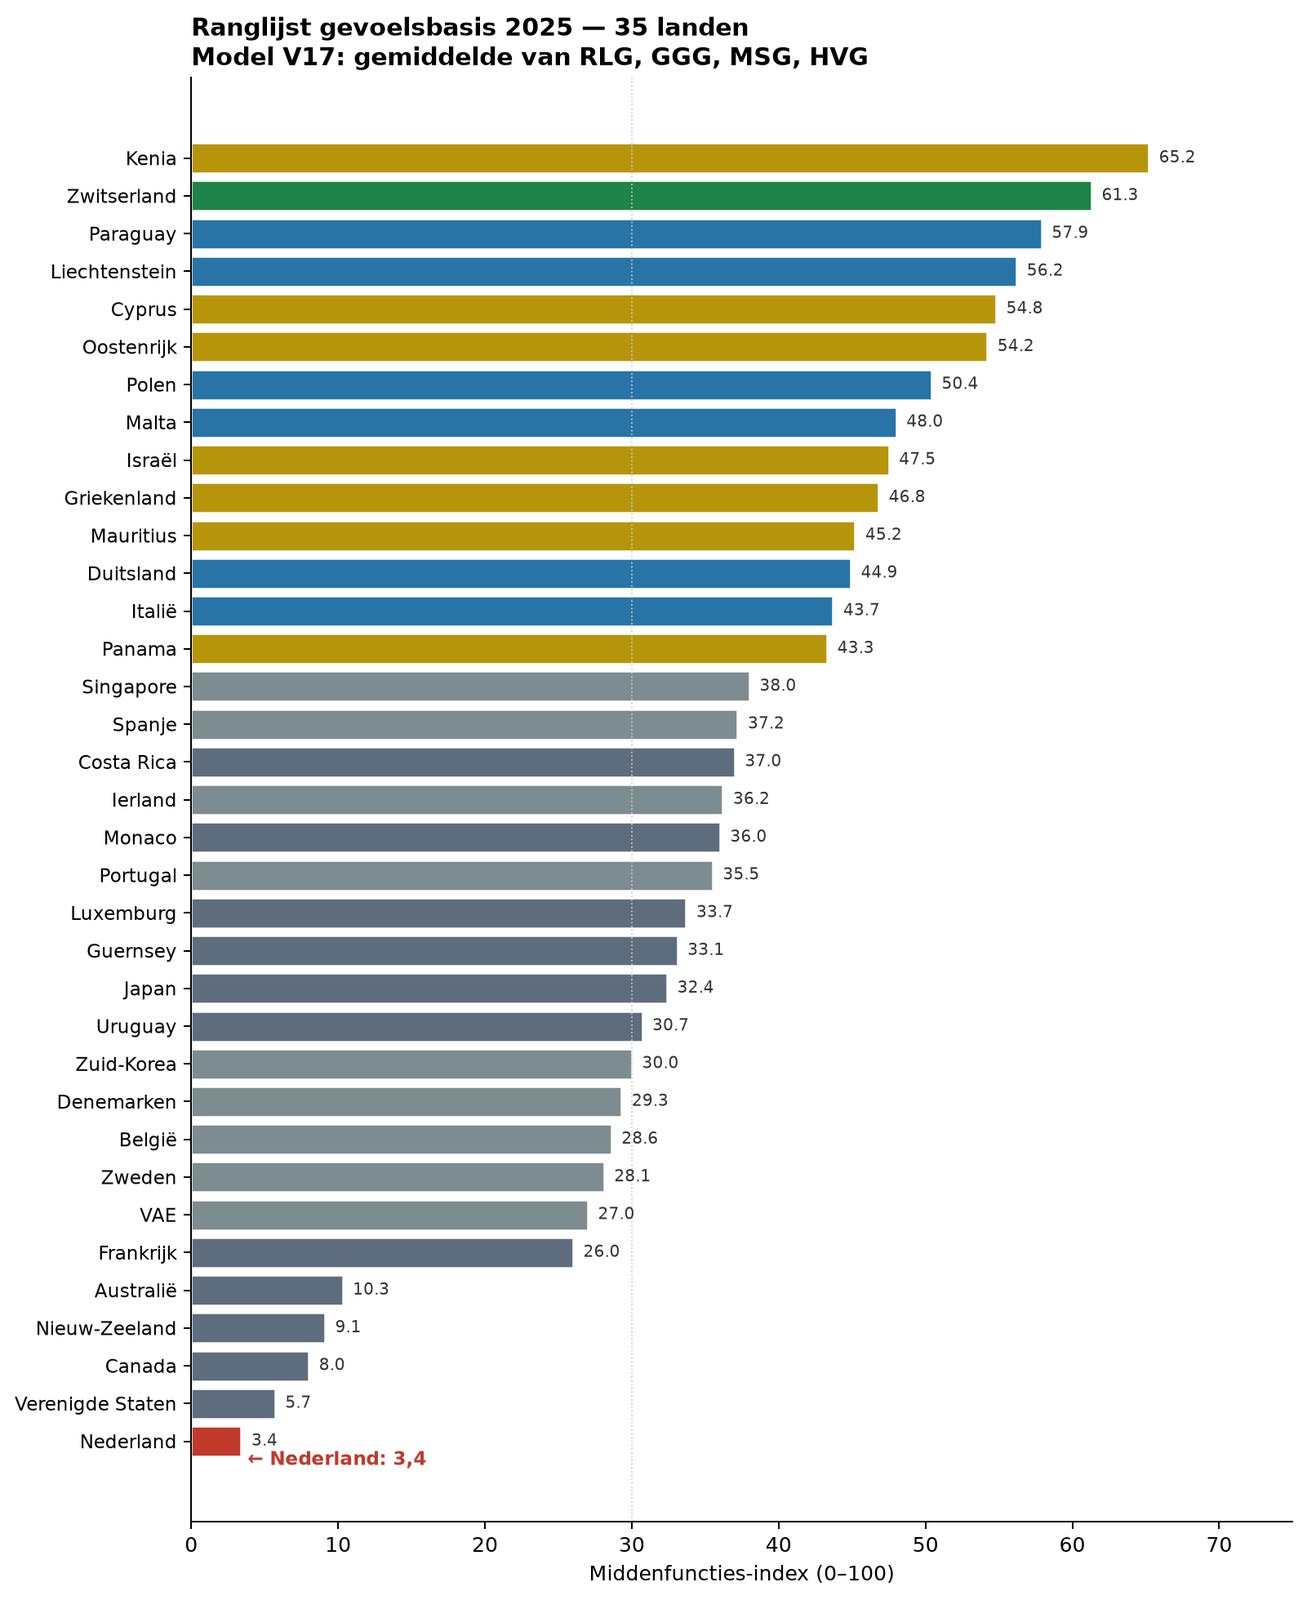
The outcome is confronting. Switzerland scores 61.3 and maintains its level over 25 years. The Netherlands scores 3.4. That is not a rounding and not a typo: it is almost twenty times less than Switzerland, less than the United States (5.7) and Canada (8.0), and the lowest figure in the entire dataset.
At the bottom, with a 0 that nobody hears
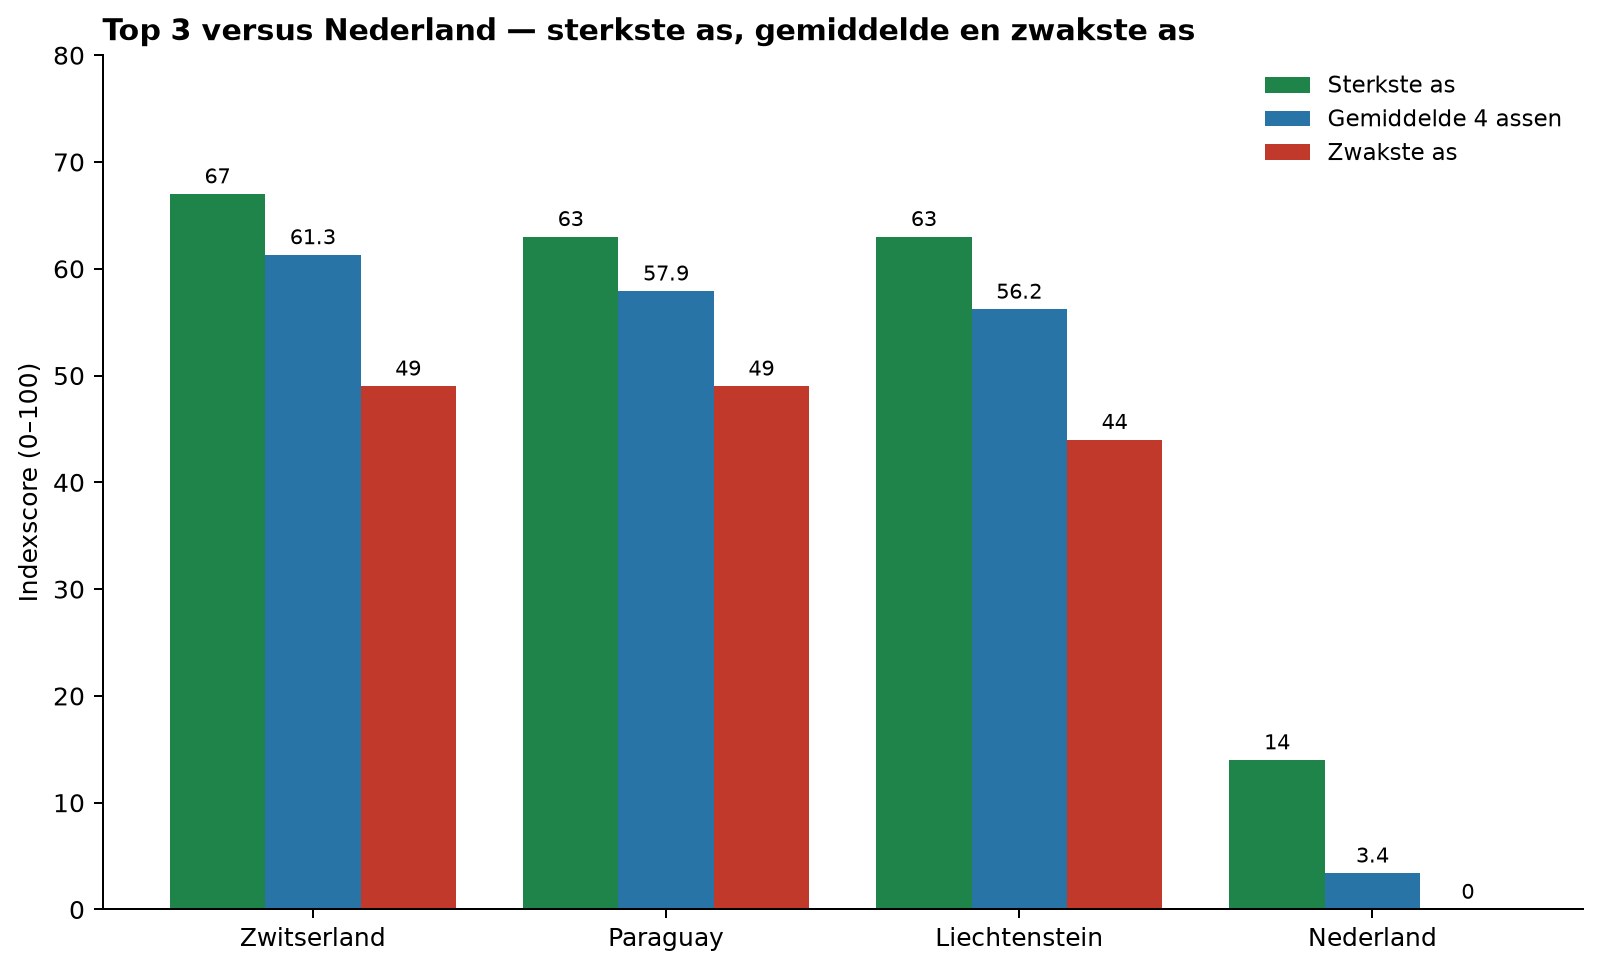
The interpretation of the Netherlands in the report is clinical: strongest axis is spatial-bodily (RLG) with 14 points — weak. Weakest axis is boundary-and-feeling (GGG) with 0 points. Zero. In the model, that means: the ability to feel and respect an inner or interpersonal boundary is collectively functionally absent. Since 2000, the country has lost 31.4 points. Quadrant D: “both dimensions weakened”. The report literally characterizes the Netherlands as a double low point.
The paradox: happy and empty
Ask any random Dutch person and the picture is exactly the opposite. 85.3% say they are satisfied with their own lives. 93% give their own lives a passing grade. In 2023, the Netherlands ranked first in the EU in life satisfaction and fifth in the World Happiness Report 2025. More than seven in ten feel connected to the Netherlands, six in ten believe that “most people can be trusted”.
At the same time, that same population mostly believes that the country is heading in the wrong direction (53% winter 2025/2026, earlier that year 59%), gives the government a failing grade for trust (52%), and has seen trust in the EU fall from 66% to 58%. It is the paradox that sociologist Ruut Veenhoven coined years ago as “discontent in paradise”: high scores on everything you can count, growing unease about everything you have to feel.
A map the Netherlands does not want to read
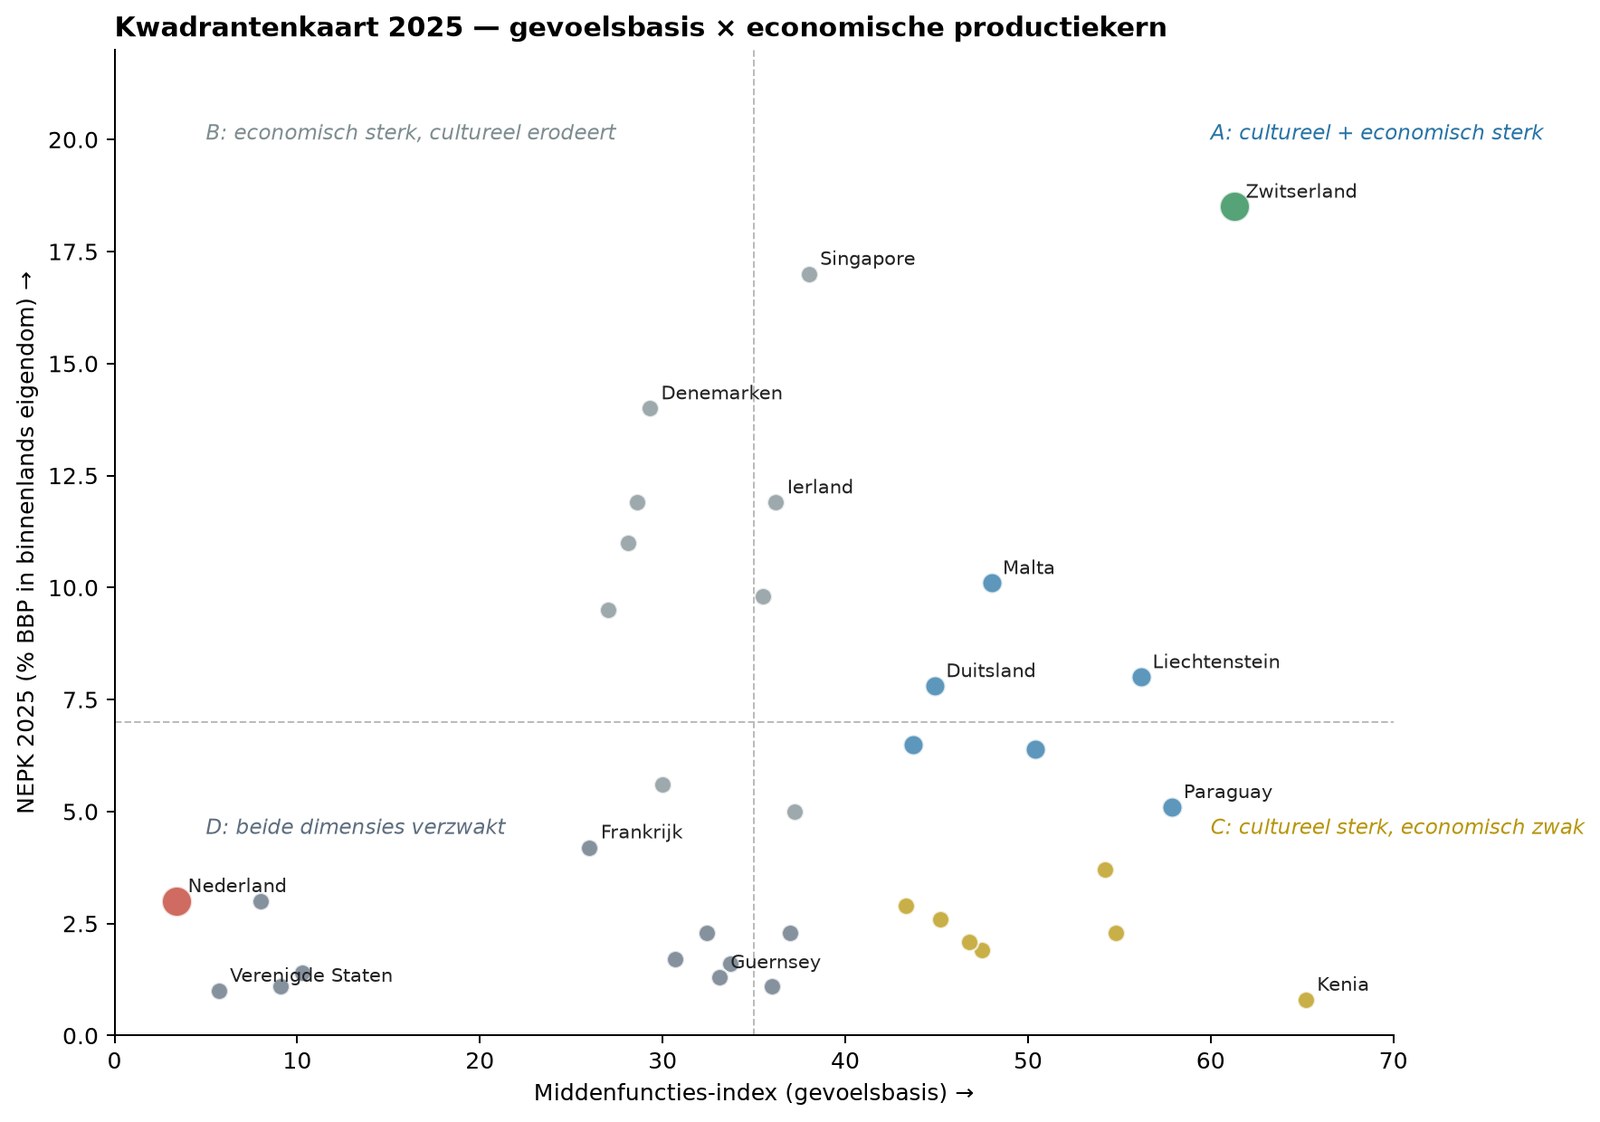
The quadrant map places feeling base against economic production core (NEPK — the part of productive value that genuinely remains in domestic ownership). Switzerland is in the rare combination there: culturally and economically strong. Malta and Liechtenstein follow. The Netherlands lies isolated in the lower left — with the United States and Australia as neighbors, not Germany or Denmark.
25 years of erosion: not an accident, a line
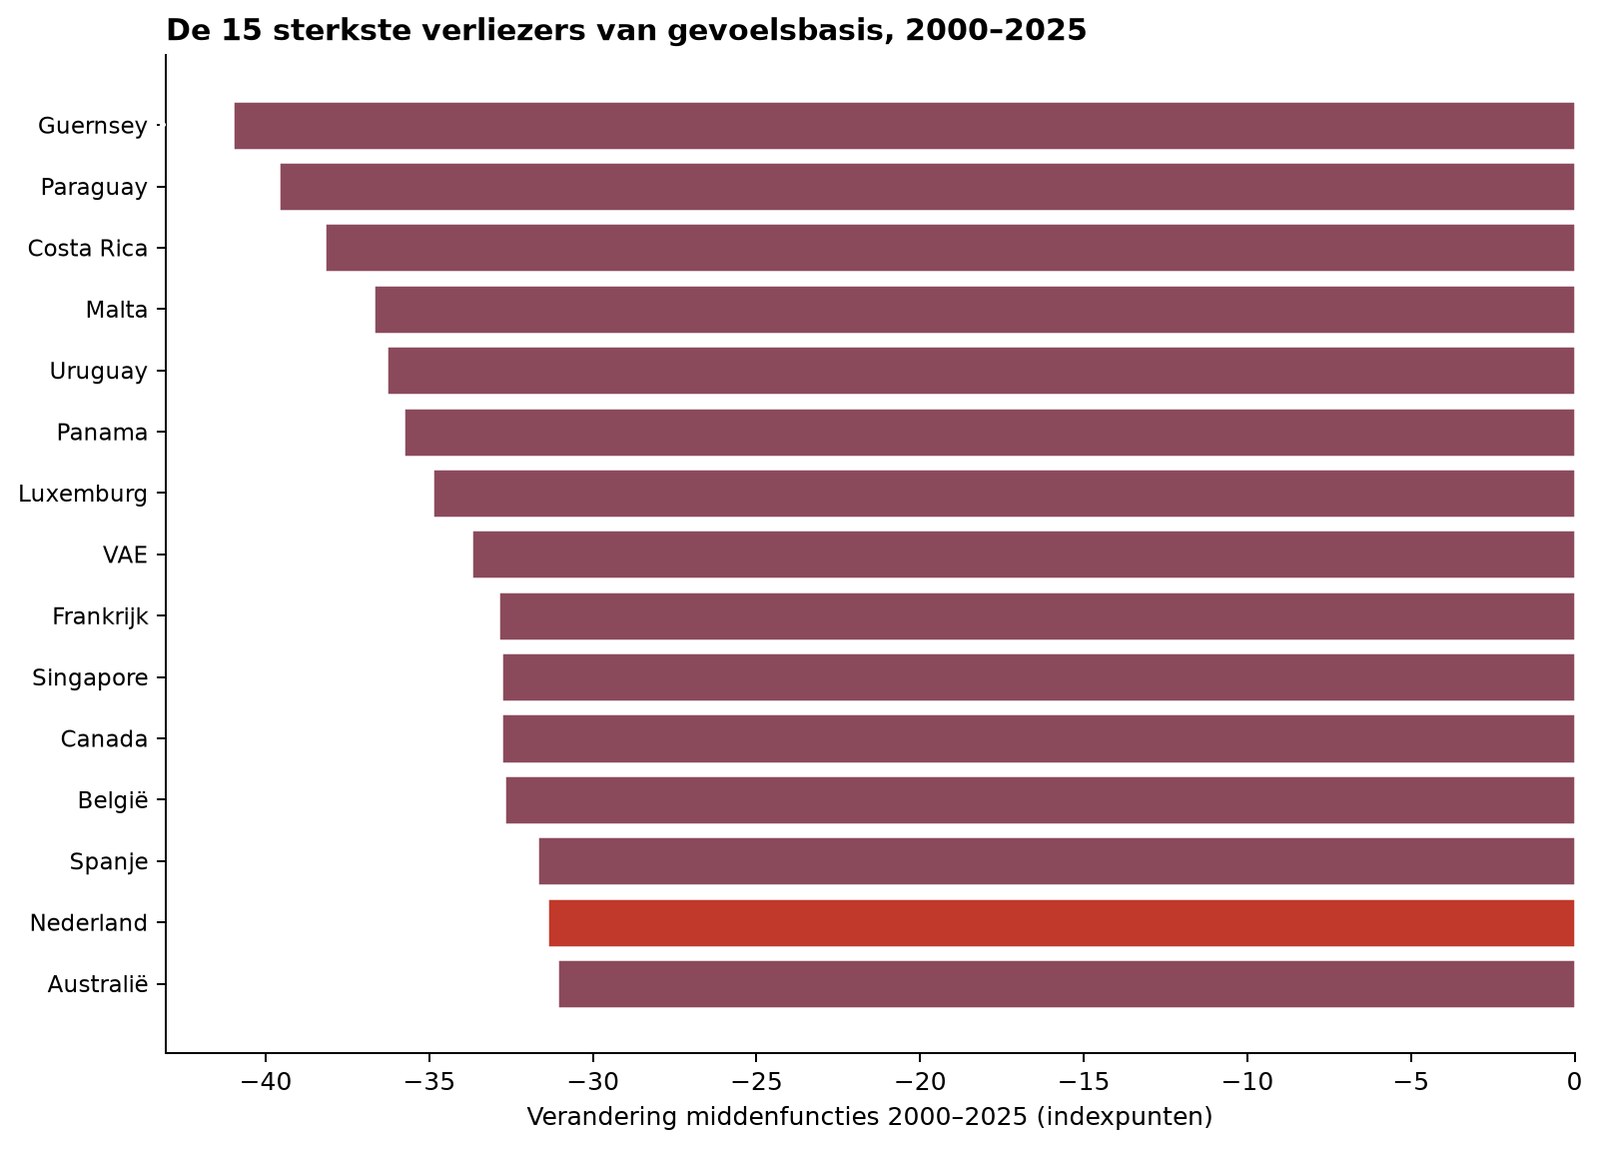
The Netherlands is not an exception in the decline — almost every Western country lost mid-functions between 2000 and 2025. But the Netherlands did fall through the floor. The loss of 31.4 points in twenty-five years places it in the same order of erosion as the biggest losers, without the buffer that those others still have.
Why the Netherlands does not see this
The obvious question is: how can a developed, literate, prosperous country fail to recognize itself in this position? The answer from the framework itself is precisely that the instrument for seeing it has also partly disappeared. Four mechanisms reinforce one another.
- Measuring instrument matches what is still there. Dutch people score highly on what is measured (satisfaction, happiness, GDP per capita, social trust). Precisely those scores do not measure a feeling base. As long as the mirror reflects prosperity and not feeling hardening, the image remains positive.
- Erosion in the same generation that must assess it. The adults who now make judgments have themselves partly grown up during the erosion phase; their frame of reference is the new floor, not the former height. You do not compare with what you have never known.
- Language before experience. Dutch education teaches children to produce labels and opinions before the sensory underlayer has solidified. Those who learn to talk without first feeling can recite a ranking without recognizing the dimension that the ranking measures.
- Cultural horizontalism. “Just act normal”, the cool-frog culture and the anti-hierarchical reflex make comparison upward suspect (arrogant, elitist) and downward embarrassing (chauvinistic). The result is a culture that no longer calibrates itself — neither against Switzerland nor against anyone else.
Where the feeling base becomes thin, the intellect will try to take over that function. The Netherlands compensates with protocols, figures, process descriptions, satisfaction surveys and meetings. That works as long as the environment is stable and the questions are technical. As soon as the question is “how does it feel where we stand”, that compensation mechanism gives the only answer it knows: “an average 7.7, thank you”.
The full ranking
All 35 countries, sorted by mid-functions score 2025.
| # | Country | Mid-functions | NEPK 2025 | Δ since 2000 | Quadrant |
|---|---|---|---|---|---|
| 1 | Kenya | 65.2 | 0.8% | −22.1 | C |
| 2 | Switzerland | 61.3 | 18.5% | −22.4 | A |
| 3 | Paraguay | 57.9 | 5.1% | −39.6 | A |
| 4 | Liechtenstein | 56.2 | 8.0% | −31.0 | A |
| 5 | Cyprus | 54.8 | 2.3% | −28.3 | C |
| 6 | Austria | 54.2 | 3.7% | −23.8 | C |
| 7 | Poland | 50.4 | 6.4% | −25.4 | A |
| 8 | Malta | 48.0 | 10.1% | −36.7 | A |
| 9 | Israel | 47.5 | 1.9% | −27.8 | C |
| 10 | Greece | 46.8 | 2.1% | −26.6 | C |
| 11 | Mauritius | 45.2 | 2.6% | −29.2 | C |
| 12 | Germany | 44.9 | 7.8% | −26.6 | A |
| 13 | Italy | 43.7 | 6.5% | −27.3 | A |
| 14 | Panama | 43.3 | 2.9% | −35.8 | C |
| 15 | Singapore | 38.0 | 17.0% | −32.8 | B |
| 16 | Spain | 37.2 | 5.0% | −31.7 | B |
| 17 | Costa Rica | 37.0 | 2.3% | −38.2 | D |
| 18 | Ireland | 36.2 | 11.9% | −31.0 | B |
| 19 | Monaco | 36.0 | 1.1% | −29.1 | D |
| 20 | Portugal | 35.5 | 9.8% | −29.0 | B |
| 21 | Luxembourg | 33.7 | 1.6% | −34.9 | D |
| 22 | Guernsey | 33.1 | 1.3% | −41.0 | D |
| 23 | Japan | 32.4 | 2.3% | −27.0 | D |
| 24 | Uruguay | 30.7 | 1.7% | −36.3 | D |
| 25 | South Korea | 30.0 | 5.6% | −31.0 | B |
| 26 | Denmark | 29.3 | 14.0% | −19.3 | B |
| 27 | Belgium | 28.6 | 11.9% | −32.7 | B |
| 28 | Sweden | 28.1 | 11.0% | −21.7 | B |
| 29 | UAE | 27.0 | 9.5% | −33.7 | B |
| 30 | France | 26.0 | 4.2% | −32.9 | D |
| 31 | Australia | 10.3 | 1.4% | −31.1 | D |
| 32 | New Zealand | 9.1 | 1.1% | −29.0 | D |
| 33 | Canada | 8.0 | 3.0% | −32.8 | D |
| 34 | United States | 5.7 | 1.0% | −29.6 | D |
| 35 | Netherlands | 3.4 | 3.0% | −31.4 | D |
How do you read this report?
Model V17 is a systems model, not a population survey. It combines 41 measured inputs per country via a contribution matrix into four axes, scaled from 0–100. The figures are therefore stronger than happiness scores (which measure judgments), but weaker than a gold-standard cohort study (which does not yet exist). The direction of the findings — Switzerland stable at the top, the Netherlands sharply downward — is robust; the exact figures remain a model outcome, not a measured population figure.
What is needed to see it after all
There are three steps that can restore the gaze, none of them quick. First: a generation that once again experiences first and puts it into words afterward — in education, family and public space. Second: comparative measurements that do not stop at prosperity and happiness, but publish the mid-functions themselves, so that the discussion gets a shared figure. Third: institutional places where judgment is corrected not only by reason but also by feeling — where direct democracy in Switzerland is a living example of this.
Until that happens, the Netherlands will continue congratulating itself on fifth place on the world happiness list, while the front doors in the street continue to explode. Not because the country is stupid. Because it has allowed precisely those senses to atrophy that it needs to feel its own position. And without those senses, a 3.4 is not an alarm signal — it is invisible.
Sources
- Model V17 — Woonlands analysis of 35 countries, mid-functions and NEPK, September 2026 (internal report).
- CBS, Social Cohesion and Well-being Survey 2025 — 85.3% satisfied with life.
- SCP, Citizens’ Outlook 2025 and 2026 — 53–59% believe that the Netherlands is heading in the wrong direction; 93% give their own lives a passing grade; social trust 6 in 10.
- World Happiness Report 2025 — the Netherlands in fifth place with a score of 7.31.
- Ruut Veenhoven, Discontent in Paradise — on the satisfaction paradox in the Netherlands.
- Concepts from the Brain: embodied-learning-and-feeling-base, feeling-blindness-third-dimension, feeling-AI-base architecture, putting-into-words learning program.