
Honesty makes governing possible
Let the government be honest and put reality on the table — a triptych
Jacobus van Merksteijn
- Author — Jacobus van Merksteijn
- Date — 20 July 2026, Palma, Mallorca
- Section — Political-economic triptych · Edition 2 · Edition Nova Democratia
- Basis — Four layers of government debt · PBW formula · European mirror · Children’s bill · Without brakes · Forbidden question (gas)
- Sources — CBS, CPB, Eurostat, Bruegel, WRR, TNO, Netspar
Since Balkenende, no Dutch prime minister has been willing to say aloud what every economist in The Hague privately knows: the 44 per cent government debt with which we boast is not a lie, but it is only half the story. The real burden we are passing on to our children is approaching 250 per cent of GDP in gross obligations. And that is only the accounting layer. Beneath it lies an even greater failure: at the same time, we have systematically dismantled the productive foundation of our country. Nuclear power closed, energy costs driven up, industry driven out, the decommissioning costs of wind and solar deferred to the future, and at all three levels of government every brake on spending released.
Why this triptych
This triptych brings those confessions of debt together. Not as a party-political attack — every coalition since 2002 has contributed to it, including the parties most of us once voted for. Not as a declaration of war on trade unions or employers — we were all sitting at the same incomplete table. But as a factual foundation for the conversation we must have at the collective bargaining table, in the municipal council, in Brussels and at the dinner table. Without honest figures, there can be no fair negotiation. Without acknowledgement, there is no mandate for the change that is needed. And without change, we saddle our children with a country we ourselves would no longer want to inherit.
"Honesty makes governing possible. As long as we conceal reality, every negotiation is a shadow play — and we all lose, including those who think they are gaining in the short term."
The triptych is built around one common thread: passing the buck. But before we can discuss that debt honestly, we must repair the denominator used to express it: GDP itself. That is Part 0. Part I then examines the statistical embellishment used to conceal the national debt — and the €1,750 billion pension pot that softens the picture but does not remove it. An interlude shows how the Netherlands compares with France, Belgium, Italy, Spain, the UK and Greece; that European picture is the key to why the Netherlands in particular must open the conversation. Part II shows how we are destroying the industrial and energy base and shifting the decommissioning costs to 2050. Part III demonstrates that — unlike Germany — we have no constitutional brake on spending at any level of government. At the end: an invitation to co-operate, including with those whom we still regard as opponents.
Part 0 — The Obscured Denominator
Why every debt percentage starts with the wrong divisor
Whenever we say “44% government debt” or “110% net fair debt”, we use the same divisor: gross domestic product. We assume that this divisor measures the size of the Dutch economy — the productive strength with which we can carry our debts. But that assumption is the first mistake. The GDP reported by Statistics Netherlands is not a measure of production. It is an aggregate in which three types of items are mixed together:
- Actual production. Factories making goods, drivers transporting them, nurses providing care, farmers growing crops. This is what an economy actually produces.
- Accounting imputations. Imputed rent (€97 billion in 2024): Statistics Netherlands pretends that homeowners pay rent to themselves — pure statistics, with no euro changing hands. FISIM (€40 billion): a constructed “price” for banking services derived from the margin between borrowing and lending rates. R&D capitalisation since SNA 2010: research expenditure that was previously treated as consumption is now counted as investment. Mineral extraction without depreciation of natural capital.
- Redistribution artefacts. Social benefits (€230 billion) are not recorded directly in GDP, but the consumption they finance is — with the result that unemployment becomes statistically invisible and GDP camouflages the loss of production.
The PBW formula — what remains after correction
I have therefore developed an alternative measure: Productive Broad Well-being (PBW). It is not an ivory-tower alternative; it combines existing economic insights — Kuznets’ warning (1962) that GDP was never intended as a measure of well-being, Okun’s Law (1962) concerning the costs of unemployment, and Mazzucato’s distinction between value creation and value extraction — into one testable indicator. The formula:
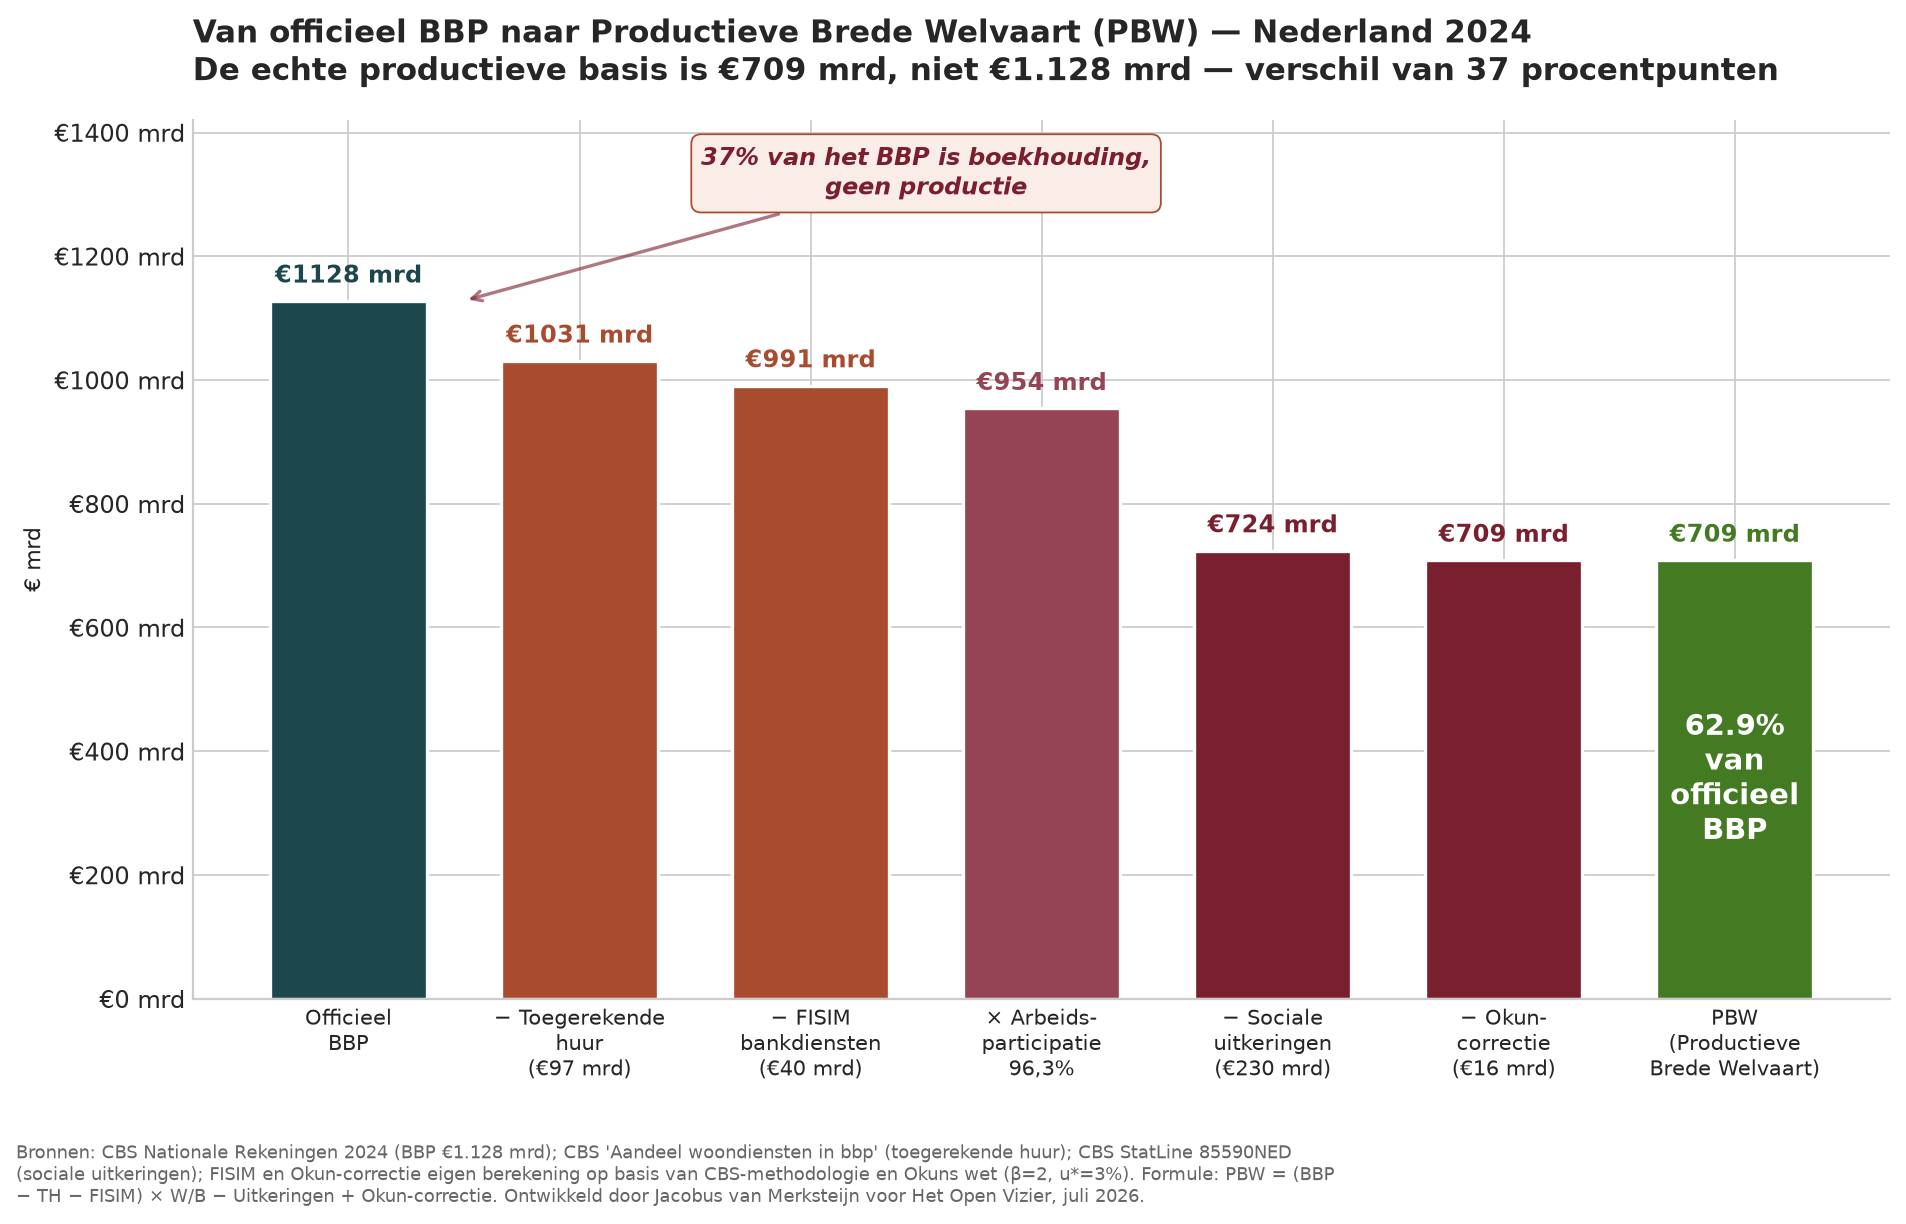
PBW = (GDP − Imputed rent − FISIM) × (Employed / Labour force) − Benefits + Okun correction
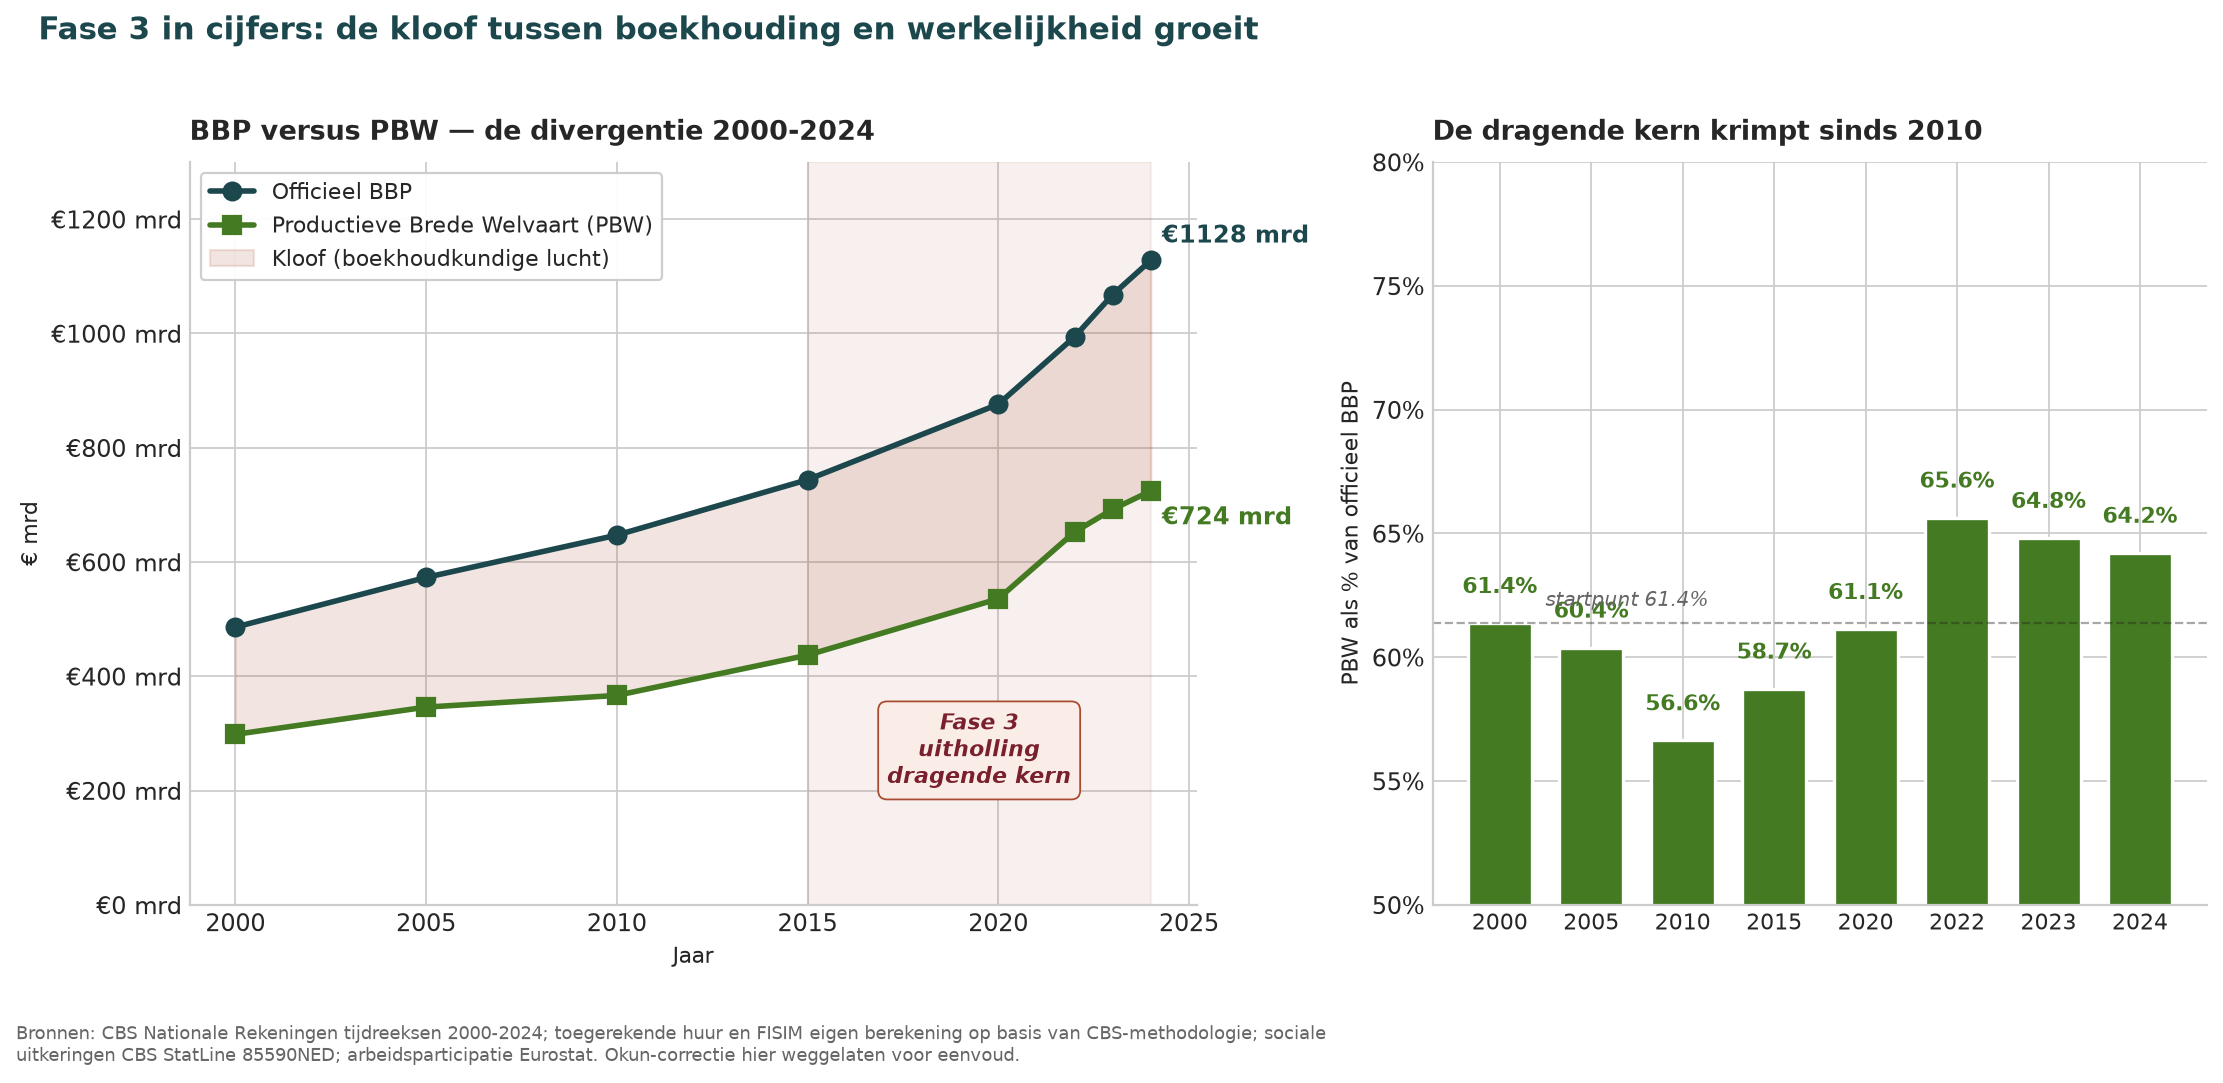
And this is not a snapshot. When you calculate PBW retrospectively back to 2000 using Statistics Netherlands time series, a structural pattern emerges: the supporting core fluctuates between 56% and 66% of GDP, with a dip in 2010 (the financial crisis) and a recovery towards 64% in 2024. This is not a linear erosion, but an indicator that moves with the health of the real economy — and that lies structurally 35 to 44 percentage points below the GDP growth suggested by the reported figures.
For 2024, PBW comes to €709 billion — 62.9% of officially reported GDP. More than one third of what we call “the Dutch economy” therefore consists of accounting constructs, redistribution-financed consumption and an incorrect treatment of human capital. This is not fraud by Statistics Netherlands — it is correctly following the internationally agreed System of National Accounts. It is a political choice to present that system as the truth.
What PBW does to the debt figures
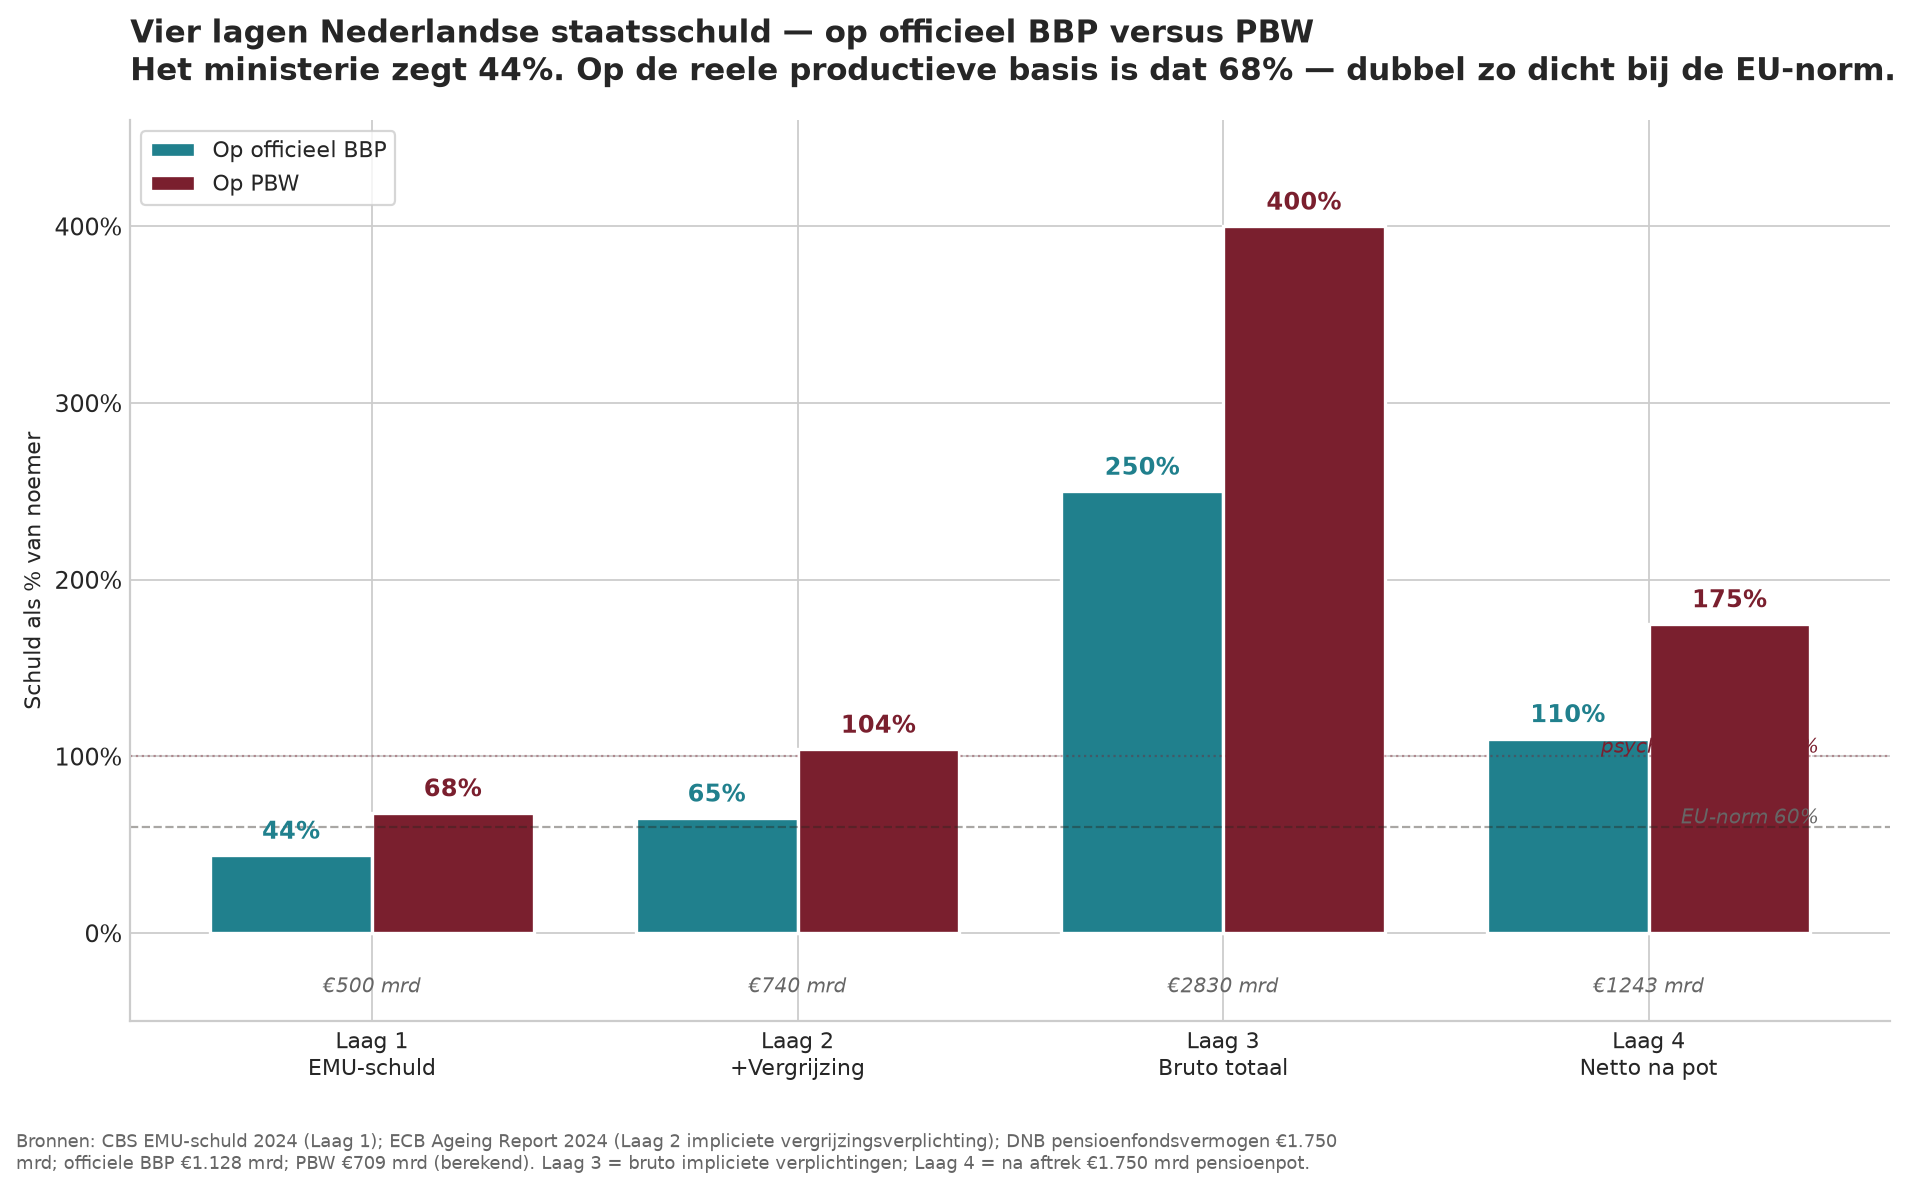
Once you use PBW instead of official GDP as the denominator, all the debt figures change dramatically:
| Debt indicator | Amount (€bn) | Against official GDP | Against PBW |
|---|---|---|---|
| EMU debt (Level 1) | €500bn | 44% | 68% |
| Including ageing commitment (Level 2) | €740bn | 65% | 104% |
| Total gross implicit debt (Level 3) | €2,830bn | 250% | 400% |
| Net fair debt (Level 4) | €1,243bn | 110% | 170% |
PBW 2024: €709bn. Calculated as (GDP − IR − FISIM) × E/L − Benefits + Okun correction.
The message of this section is not: throw GDP away. The message is: look at both. When a minister says “our debt is 44% of GDP, comfortably below the EU limit of 60%”, that is statistically correct. But on the real productive base, that same debt is 68% of PBW — above the threshold we ourselves apply. The ageing commitment (Level 2) is 104% of PBW — one-to-one with the productive base. And net fair debt is 170% of PBW: more than one and a half years of the output we actually produce.
For the sake of readability, I will continue to use the official GDP percentages throughout the rest of this article, because these are the figures used by politicians and journalists. But in the comparison tables I will consistently include the PBW alternatives, so that the reader can see both dashboards. The bill is larger than the policy jargon suggests — and it starts with the denominator.
“Distinctions must be kept in mind between quantity and quality of growth, between costs and returns, and between the short and long run. Goals for more growth should specify more growth of what and for what.” — Simon Kuznets, 1962
Part I — The Hidden Account
On the four layers of Dutch government debt and why 44% is only half the truth
The figures officially communicated
At the end of 2025, Dutch government debt stood at €524 billion — precisely 44.4 per cent of GDP. The Cabinet forecasts debt of 46.6 per cent in 2026, rising to more than 50 per cent by 2031. In all communications to trade unions, employers and citizens, this figure is used as evidence that “the Netherlands has done well” — well below the EU limit of 60 per cent and well below the EU average of 81.7 per cent.
This figure is not a lie. It is calculated according to the European EMU definition and is correct down to the last euro. But it is a snapshot of issued bonds — not of obligations. And that is where the story begins.
Four layers: from 44% to 110% fair debt
Level 2 — Already committed, not yet recorded as EMU debt
Once you consolidate what the government has already committed to but has not yet recorded as EMU debt — multi-year commitments for defence, the Climate Fund, compensation for damage in Groningen, nitrogen-exit schemes, the AOW shortfall that is structurally financed from general funds, plus state guarantees and holdings — the figure rises considerably. The Advisory Group on Budgetary Affairs recommended €7 billion in structural cuts for good reason, in order to stabilise the debt at all. A realistic estimate for this level is approximately 65 per cent of GDP.
Layer 3 — Gross implicit liabilities
This is the layer that politicians systematically airbrush out of the picture. The state pension (AOW) and long-term care are largely financed from general taxation without corresponding funding. The CPB itself estimates that, under unchanged policy, debt on a purely EMU basis will rise to 126 per cent of GDP by 2060. If implicit pension promises are included — the classic implicit pension debt — the gross figure falls in the range of 200 to 250 per cent of GDP. According to the Senate, the sustainability gap amounts to 1.6 per cent of GDP per year, or approximately €16 billion structurally. The WRR explicitly warns that financing pensions through rising government debt passes the bill on to future generations.
Layer 4 — Net fair debt: 110% of GDP
And then comes the adjustment that softens the picture without eliminating it. Thanks to its funded second-pillar pension system, the Netherlands has by far the largest pension assets in Europe: approximately €1,750 billion, or 159 per cent of GDP. At an average tax rate of 35 per cent on pension benefits, the government claims a deferred tax asset of approximately 55 per cent of GDP — under the tax deferral principle, contributions are untaxed and benefits are taxed. The Netherlands also owns state holdings (Schiphol, Gasunie, TenneT), infrastructure and valuable public assets; moreover, €417 billion in natural-gas revenues was collected between 1969 and 2021, part of which is implicitly reflected in public services.
Net — that is, after deducting these countervailing items — the Netherlands’ fair debt comes to approximately 100 to 120 per cent of GDP. That is still almost twice the EU limit of 60 per cent, and more than twice the official figure of 44 per cent. But it is fundamentally different from the bare 250 per cent without adjustment. And it is precisely this combination — a high implicit burden with substantial countervailing assets — that gives the Netherlands a unique position in Europe.
The statistical embellishment: imputed rent
As well as concealing liabilities, the denominator — the GDP against which the debt ratio is calculated — is also systematically inflated. Statistics Netherlands records so-called ‘imputed rent’ on owner-occupied homes, amounting to €54 billion a year, as household production, as if homeowners were renting their homes to themselves at the market rate. With GDP at approximately €1,100 billion, that means 5 per cent of GDP exists purely as an accounting entry: not a single euro exchanged, no tax collected, and no service provided to a third party.
This is not a typically Dutch trick — the US (6.2%), the UK (10%), Japan (10%) and Ireland do the same under the ESA 2010 standard. What does distinguish the Netherlands is that Eurostat found imputed rent reduces income inequality in almost every EU country — except the Netherlands and Norway, where it actually increases inequality. Even the social justification fails here.
Interlude — The European Mirror
Why the Netherlands in particular should open the European debate — the four layers across twelve countries
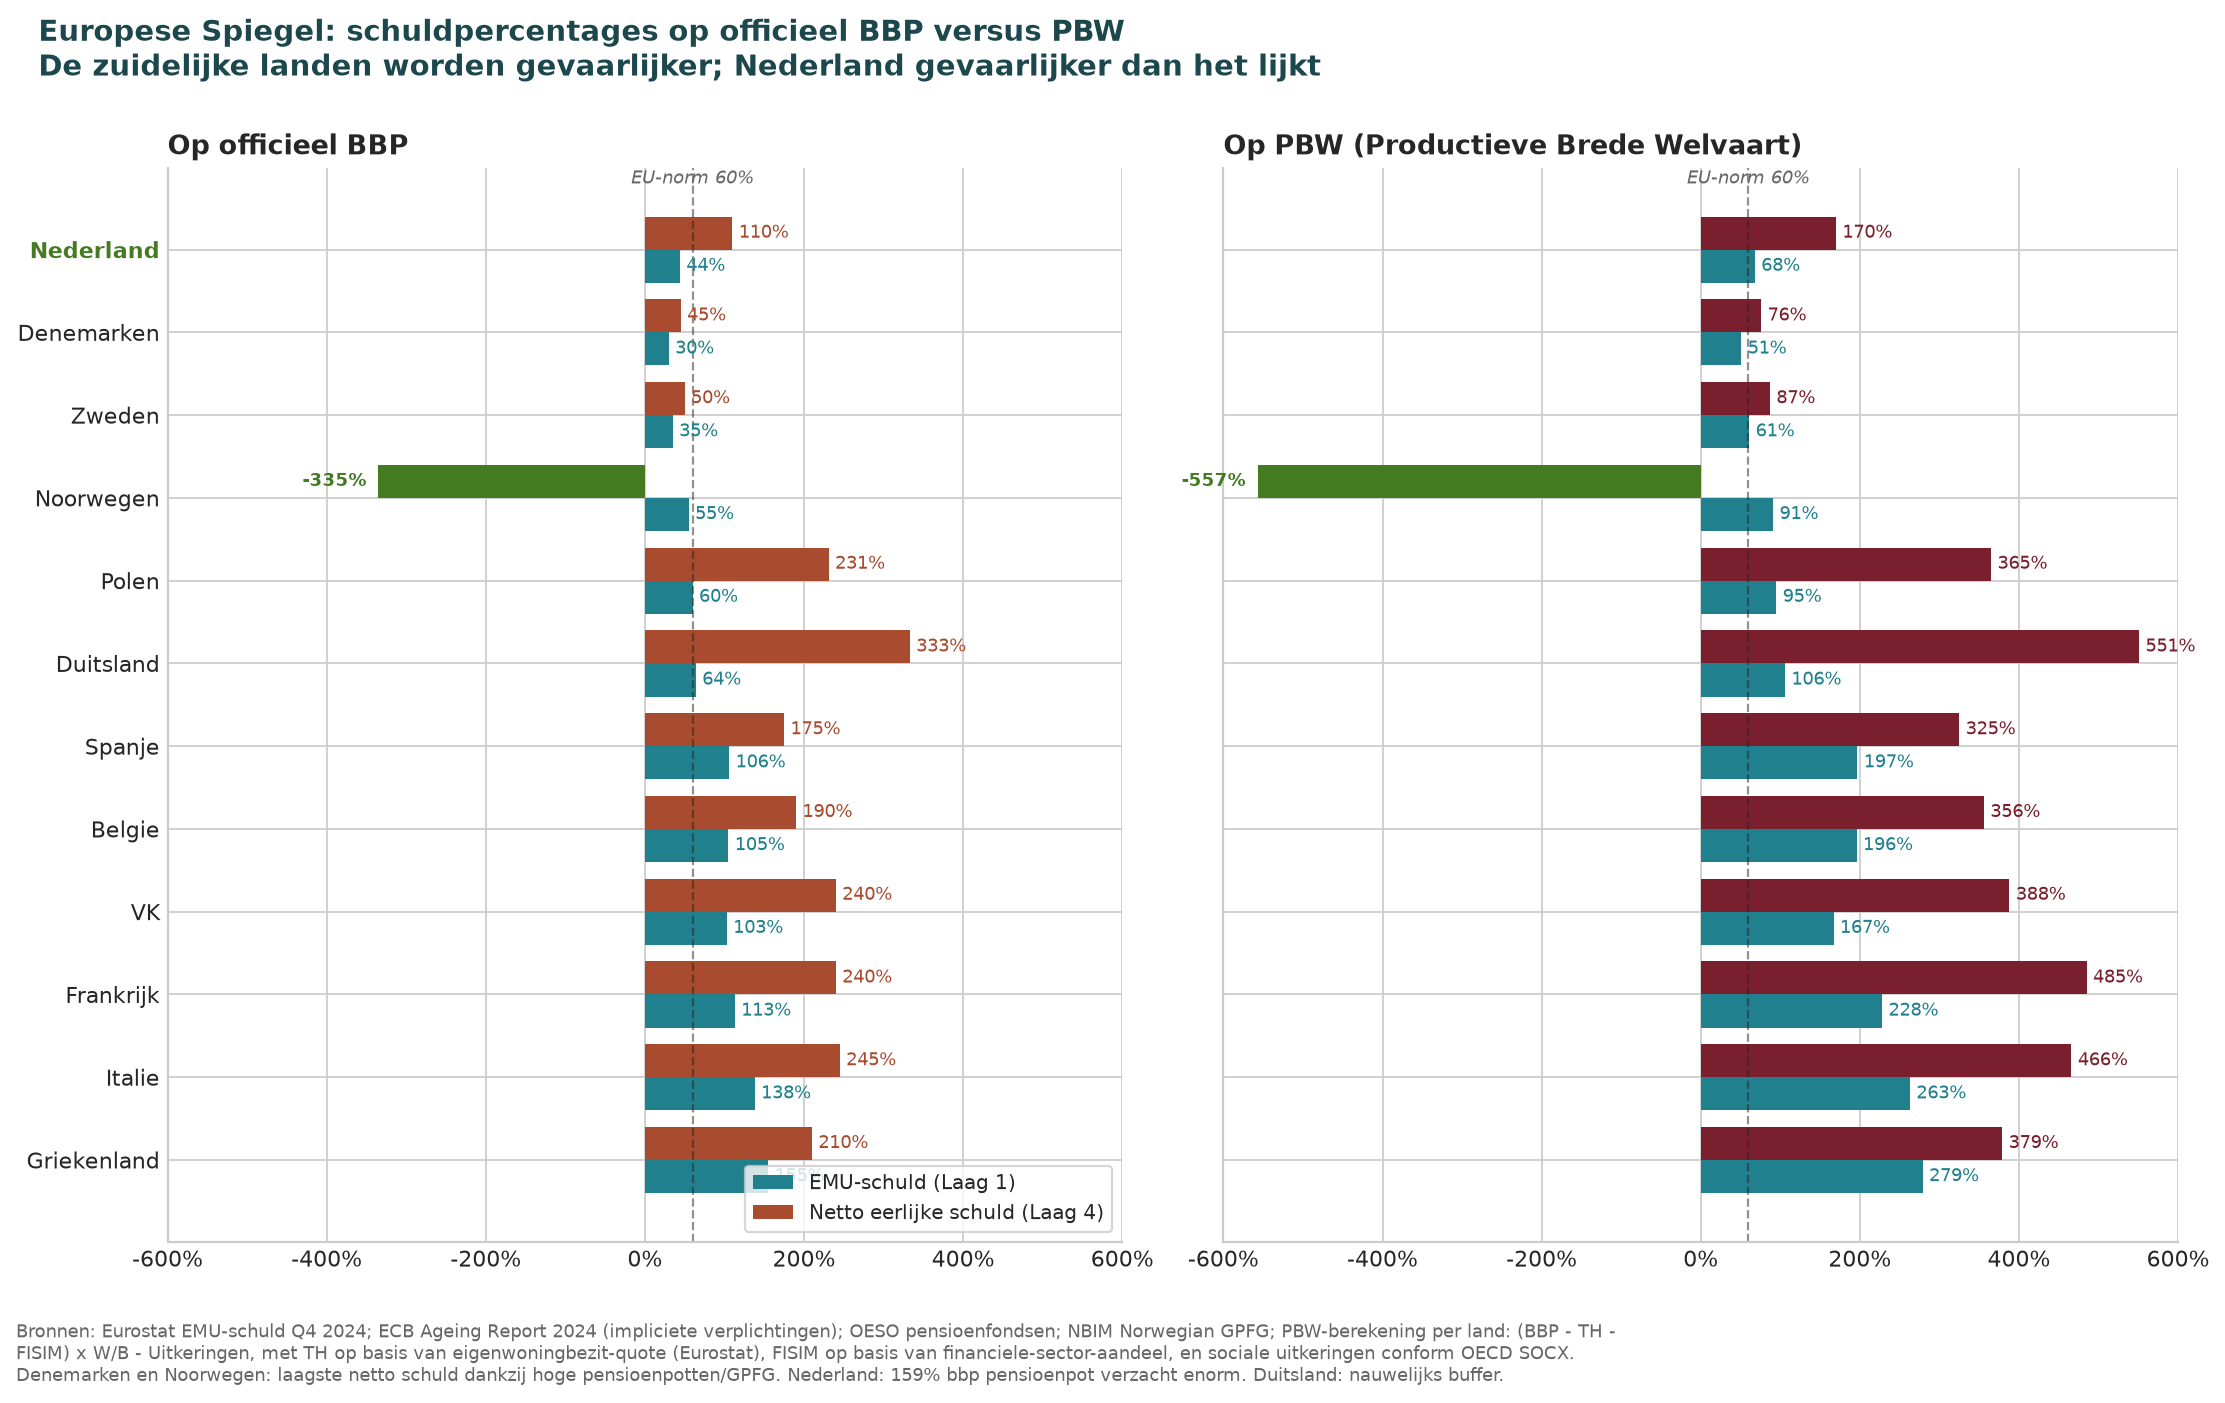
Before you conclude that we are doing badly: let me hold up a mirror. When you apply the same four layers to eleven comparable European countries, you arrive at a picture that Dutch politicians keep out of the public conversation at all costs — but which in fact gives the Netherlands the authority to be the first to tell the truth.
| Country | EMU debt | Pension assets (2nd pillar) | Net fair on GDP | Net fair on PBW |
|---|---|---|---|---|
| Netherlands | 44% | 159% of GDP | ~110% | ~170% |
| Denmark | 30% | 206% of GDP | ~45% | ~76% |
| Sweden | 35% | ~90% of GDP | ~50% | ~87% |
| Norway (GPFG) | 55% | 490% of GDP | −335% | −557% |
| Poland | 60% | ~9% of GDP | ~231% | ~365% |
| Germany | 64% | ~7% of GDP | ~333% | ~551% |
| UK | 103% | 100% of GDP | ~240% | ~388% |
| Belgium | 105% | 8% of GDP | ~190% | ~356% |
| Spain | 106% | 11% of GDP | ~175% | ~325% |
| France | 113% | 9% of GDP | ~240% | ~485% |
| Italy | 138% | 11% of GDP | ~245% | ~466% |
| Greece | 155% | 1% of GDP | ~210% | ~379% |
Sources: Eurostat Q4 2025; OECD Pension Markets in Focus 2025; Netspar/PSE/Cato Institute; Eurostat Pensions in national accounts 2024.
What stands out — five insights
The Netherlands’ position is fundamentally different from that of comparable European economies. Five things stand out that should change the debate in the Netherlands:
- The Netherlands has by far the strongest buffer. With pension assets equivalent to 159% of GDP, we score twice as highly as Switzerland and Canada, and fifteen to twenty times higher than France (9%), Italy (11%), Belgium (8%) or Spain (11%).
- Our net fair debt is the lowest among the non-Scandinavian European countries. On official GDP: 110% (the Netherlands) versus 190% (Belgium), 240% (France/UK), 245% (Italy), 175% (Spain), 210% (Greece) and 333% (Germany). On PBW: 170% (the Netherlands) versus 356–551% for those other countries. Only Denmark (76%), Sweden (87%) and Norway (−557%) perform significantly better, thanks to their sovereign funds. Germany is a nightmare scenario: 64% EMU debt sounds modest, but with its weak pension assets and severe ageing, net fair debt exceeds 550% of PBW.
- For France, Belgium, Italy, Spain and Greece, confession has become politically impossible. Bruegel calculates that France needs to improve its primary balance by 4–5% of GDP merely to keep pace with ageing. The same applies to Italy. According to the Paris School of Economics, France’s implicit pension debt lies between 210 and 470 per cent of GDP. A French president who admitted this would lose their government within weeks.
- We can bear the burden — they cannot. That makes our pension assets not an excuse to remain silent, but rather a mandate to speak. We are the only ones able to tell the truth without the system immediately imploding.
- Implicit European debt is a systemic risk. The European Commission classifies eleven Member States as being at ‘high fiscal sustainability risk’, including Belgium, France, Italy, Spain and Greece. If one of them collapses, it will drag down the eurozone and therefore the Netherlands. Our €1,750 billion pension fund is partly invested in precisely those European bonds. Our security depends on their reforms.
“Our pension fund does not make us immune. It makes us authorised to tell the truth — because we are the only ones who can bear it without the system imploding.”
Why this is the Netherlands’ role
Traditionally, the Netherlands has been Europe’s treasurer — the small-minded bookkeeper of ‘keep your house in order’. That is not a strong role in political negotiations; the French and Italians are annoyed by it, and rightly so. But once you carry out the four-layer analysis, it becomes clear that the Netherlands can play a different role: that of an honest broker. We are not the frugal accountant lecturing everyone else. We are the party that is uniquely willing to present the honest calculation because we are the only one to have built up the countervailing assets needed to find a way forward together.
That completely changes the framing in Brussels. Instead of ‘The Hague is complaining about budgetary discipline again’, it becomes: ‘The Netherlands is laying Europe’s debt bare — including its own 110% — and inviting everyone to pursue a shared reform path.’ That is a fundamentally different position, and for the first time since Kok it is politically available.
Why this poisons wage negotiations
Back to the domestic Dutch negotiating table. The framing ‘we have been frugal, there is room for +X%’ is only correct if you look exclusively at Layer 1. Once Layers 2, 3 and even 4 are brought into the discussion — 110% of GDP net — there is structurally no room for the usual collective-agreement formula. Trade unions sense this, without knowing the exact figures. Employers sense it too. The result: everyone at the table defends their own position on the basis of figures that everyone knows are incomplete. This is no longer negotiation; it is a shadow play.
44% visible, 65% committed, 250% gross obligations, 110% net after countervailing assets — twice the EU limit, and a sustainability gap of 1.6% of GDP per year.
Then the conversation is no longer ‘share the gains’, but ‘share the adjustment burden’. A fundamentally different negotiation. And — crucially — one in which trade unions and employers can choose the same side: against passing the burden on to the children. That is a coalition that does not yet exist, but could become possible tomorrow once the figures are placed honestly on the table.
Part II — The Children’s Bill
On nuclear power, expensive alternatives, decommissioning costs and the slow death of Dutch industry
The nuclear-power mistake — Germany and the Netherlands
In April 2023, Germany closed its final three nuclear reactors — Isar 2, Emsland and Neckarwestheim 2. The official narrative is: no price shocks, no supply problems, more renewables, less coal. Technically true in the short term, because industry was meanwhile in recession and demand had fallen. As soon as Germany emerges from recession, however, even the DIHK (German Chamber of Industry and Commerce) warns that the price effect will become visible after all.
The industrial reality is now unforgiving: BASF is relocating 10 per cent of its Ludwigshafen production to China and the US. ThyssenKrupp is cutting steel production. Volkswagen is closing factories in its home country for the first time in 87 years. The Netherlands has not formally done anything quite so dramatic — Borssele will continue operating until 2033 — but between 1997 and 2020 we wasted twenty-three years without completing a single new-build project. France currently exports 50 to 90 TWh a year to its neighbours at record prices; largely to Germany and, indirectly, to us. We do pay for French nuclear power; we simply do not receive the proceeds.
The clean-up bill through to 2050
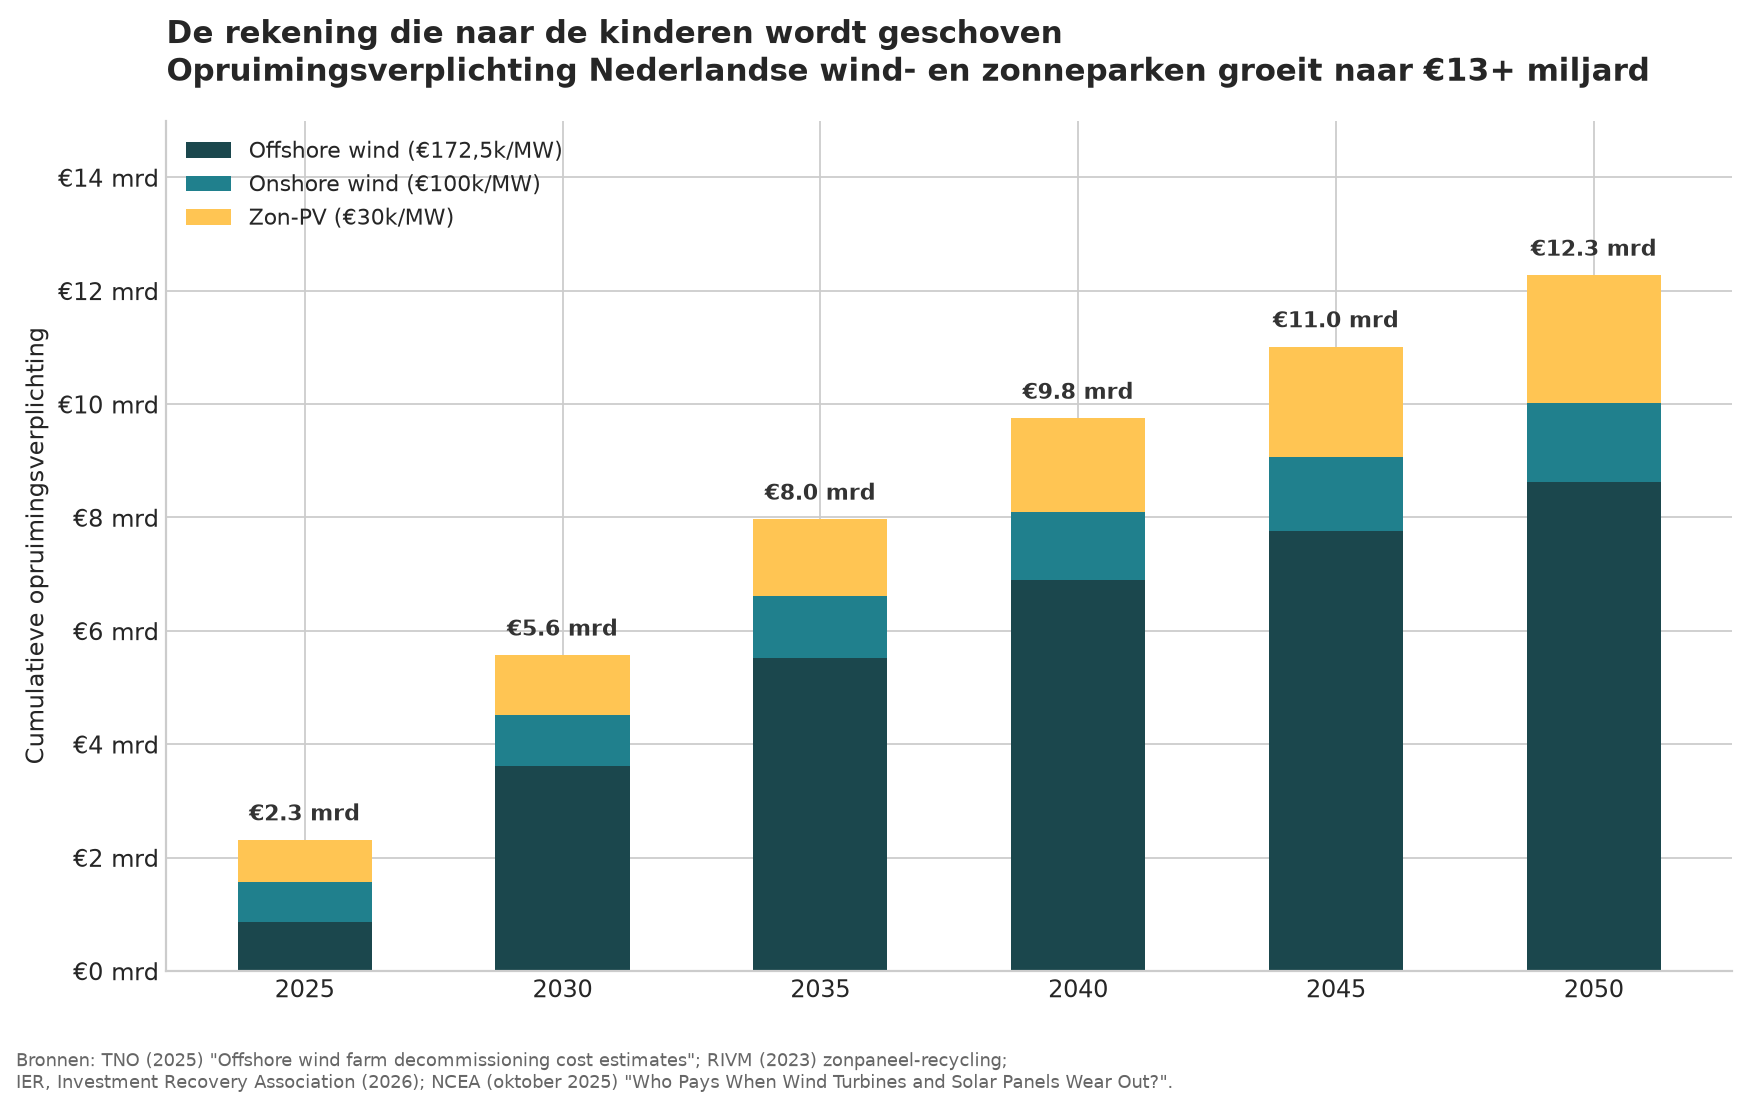
TNO estimates the cost of fully removing an offshore wind farm at €172,500 per MW. The Netherlands currently has approximately 5 GW of offshore wind capacity, rising towards 21 GW in 2030 and 50 GW in 2050. This means a future obligation of €8 to €9 billion for offshore decommissioning alone — on top of onshore wind and solar. For onshore turbines, the US-based Institute for Energy Research estimates $100,000 to $410,000 per turbine. For solar panels, RIVM shows that the standard practice is downcycling: only the aluminium frame and cables are reused.
And who will foot the bill? Precisely the issue at the heart of this trilogy: the children. The American National Center for Energy Analytics puts it plainly: "consumers or taxpayers—not the owners—will likely be left to pay a significant portion of the $50 billion or more in future decommissioning costs". Decommissioning bonds are systematically waived by regulators because otherwise projects would not be profitable — a structural accounting trick, directly analogous to the implicit national debt from Part I.
The slow murder of industry
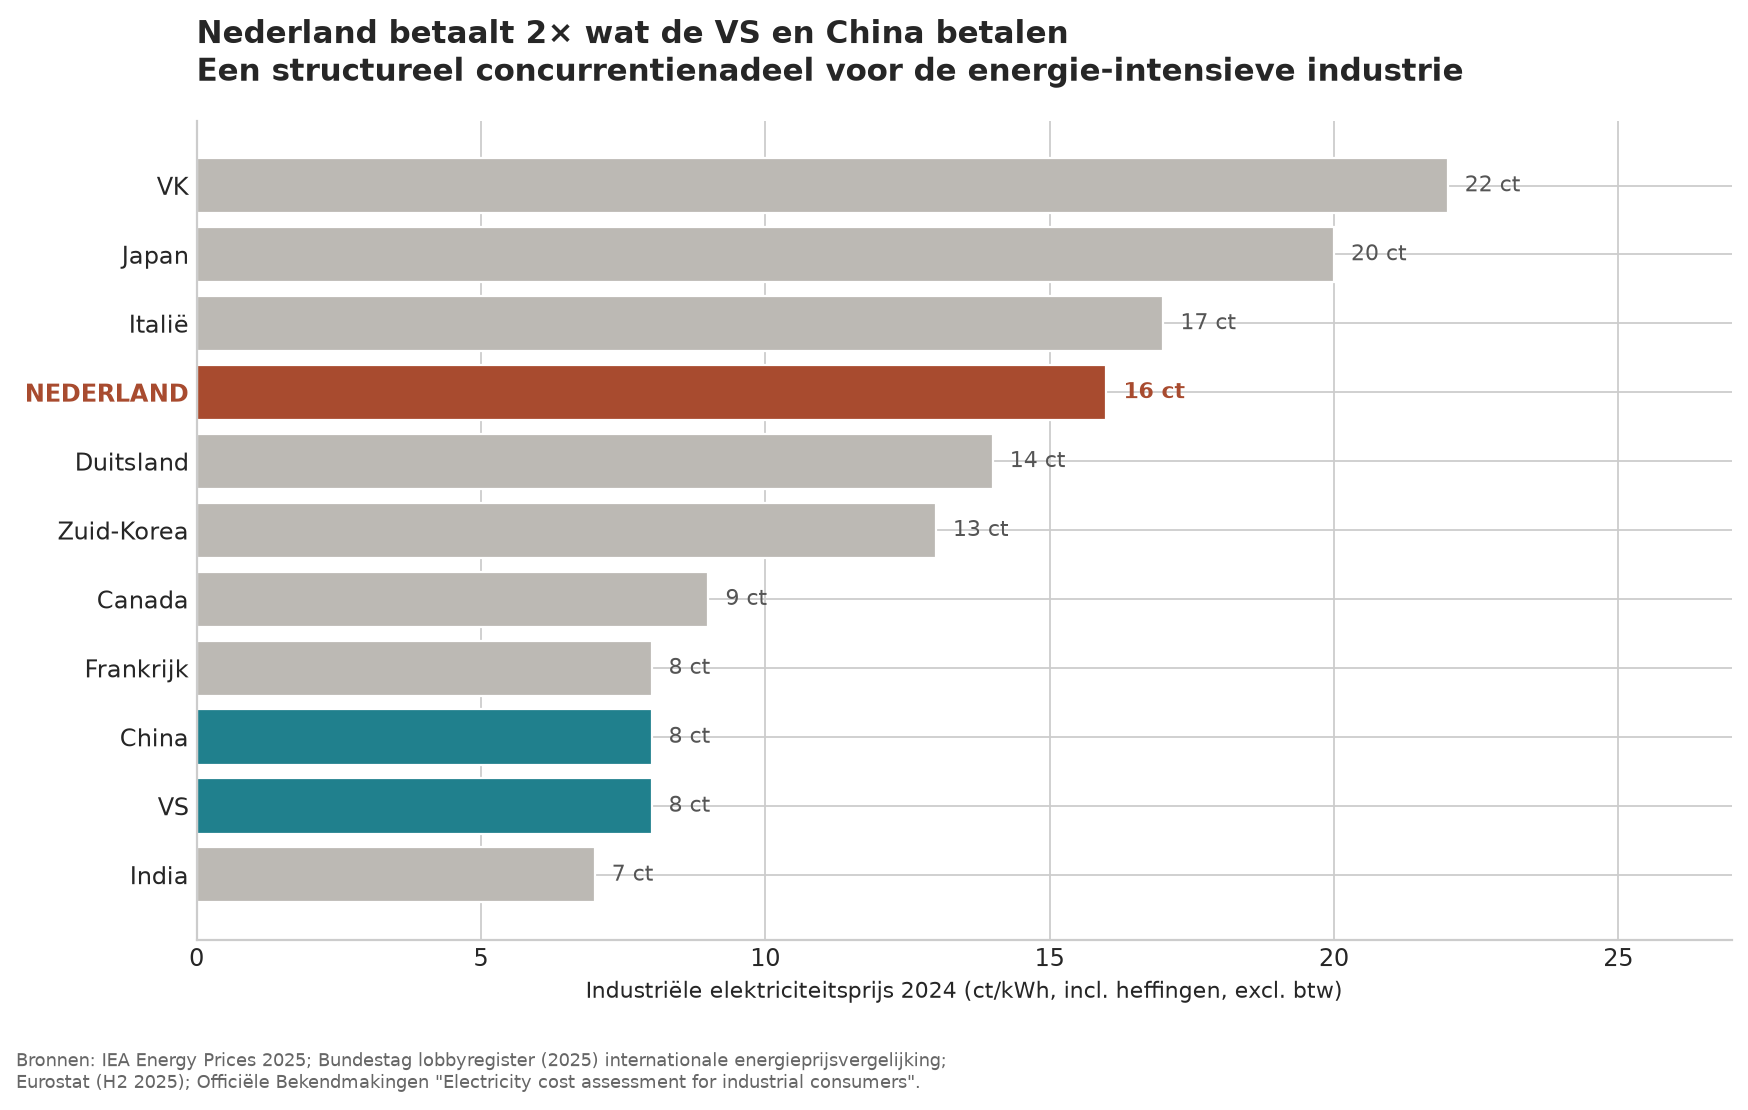
In 2024, the industrial electricity price in the Netherlands was around 16 ct/kWh — twice as high as in the US and China (8 ct), twice that of France (8 ct), and of the same order as the UK (22 ct) and Japan (20 ct). A Dutch study for the House of Representatives shows that Dutch baseload industrial customers will pay EUR 64/MWh more than their German and French competitors in 2030, solely because exemptions from network charges and levies are unavailable.
On top of this comes the accumulation of collective charges. The collective tax burden rose from 36.5% (2015) to 39.5% (2021), fell slightly to 38.9% (2022), and has since been climbing back towards 40%. The exceptional increase in the minimum wage in January 2024 (+10.15%) raised labour costs in industry, healthcare, and agriculture and horticulture in one fell swoop. The Netherlands now has one of the highest minimum wages in Europe in purchasing-power-parity terms, while energy-intensive industry is preparing to leave.
What you call the murder of industry has a name in economic jargon: structural energy cost disadvantage. The IMF and OECD have explicitly been pointing to this problem in the Netherlands and Germany since 2023. At the same time, we have closed the cheapest reliable power source (nuclear), piled up the most expensive variable sources (wind and solar), accumulated network charges and levies, and driven up labour costs through the minimum wage and collective charges. Each pillar is defensible on its own. Taken together, it is industrial suicide. And — this is the bridge to Part III — there is no law that stops it.
Part III — Without a Brake
On runaway spending at every level of government and the absence of a Dutch debt brake
The German brake — why it does not exist in the Netherlands
Since 2016, the German federal government has been permitted to borrow no more than 0.35 per cent of GDP net. This is enshrined in Article 115(2) of the Basic Law — the so-called Schuldenbremse. In November 2023, the Federal Constitutional Court declared the transfer of €60 billion between funds unconstitutional. Even the German government therefore cannot shift funds at will.
The Netherlands has never introduced this kind of constitutional brake. The Zalm standard — an informal agreement, not a law — has been systematically abandoned and is even openly being buried in NRC. Sondervermögen-like structures (the Climate Fund, National Growth Fund and Defence Fund) do exist, but escape equivalent constitutional oversight. And the historical natural-gas revenues — €417 billion between 1969 and 2021 — have largely disappeared into general government funds without a sovereign wealth fund like Norway’s.
Municipal spending doubled in fifteen years
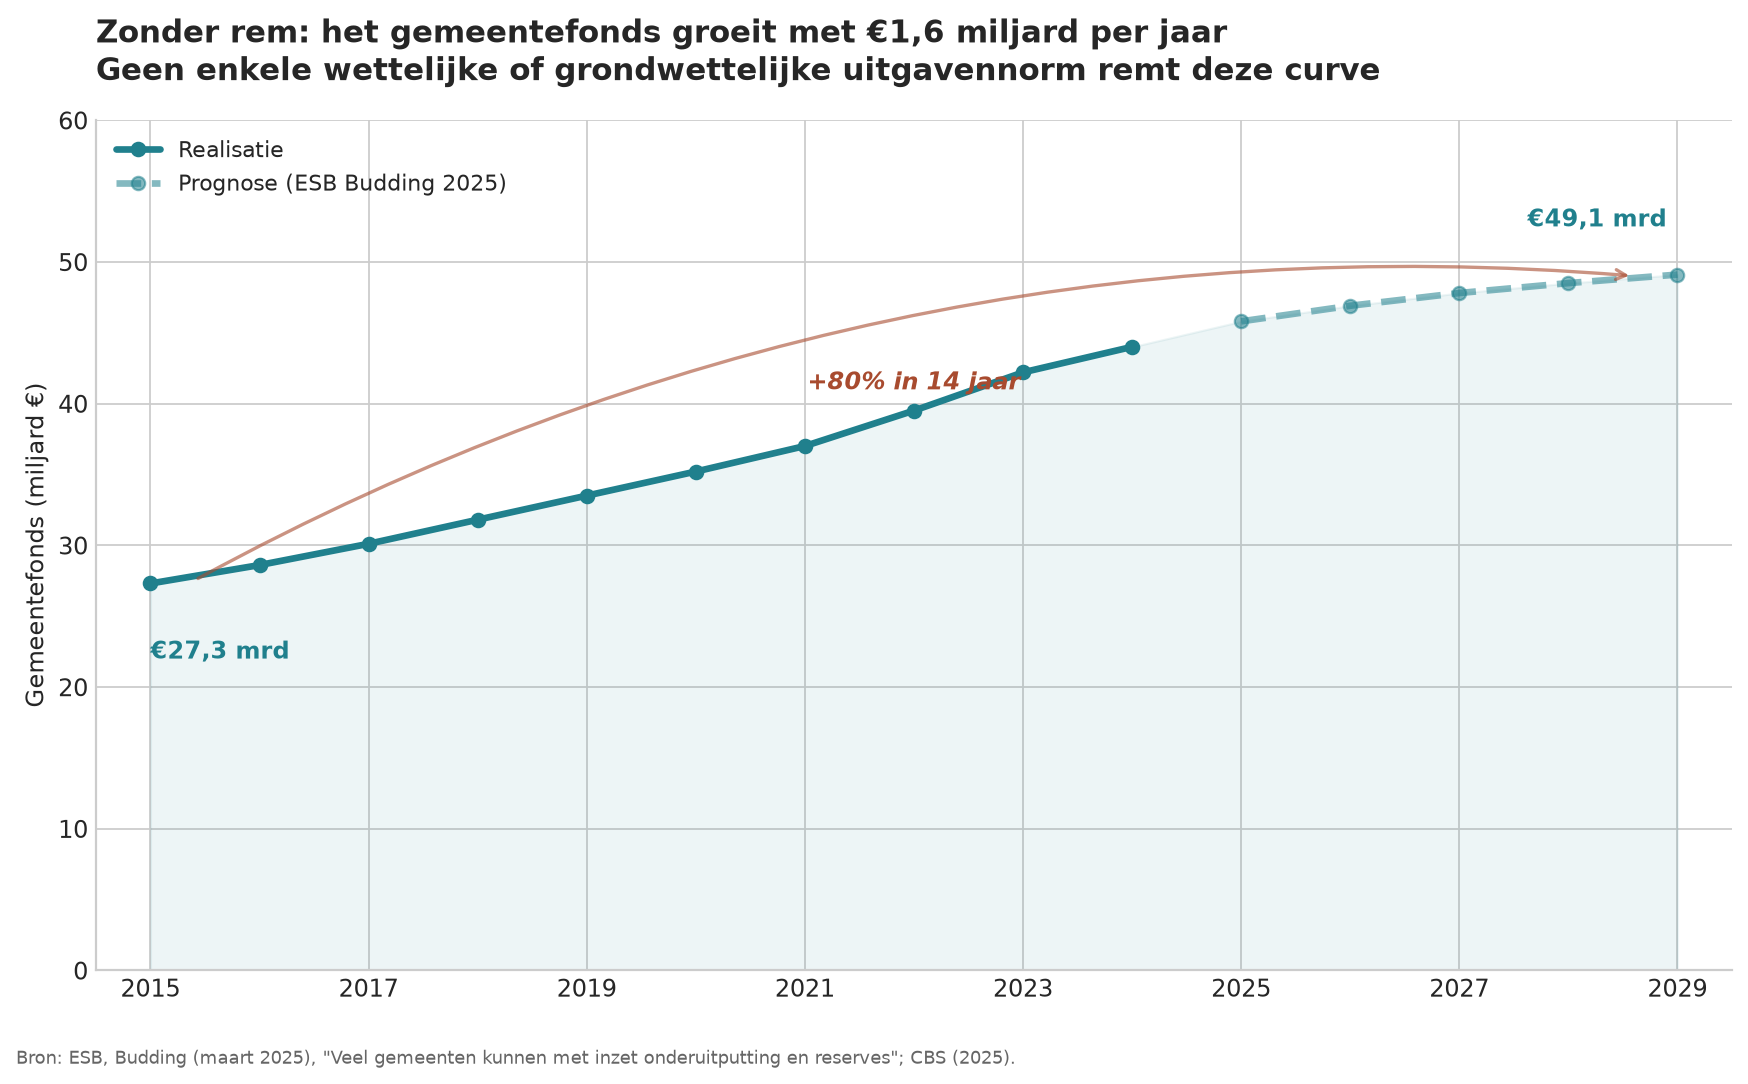
The Municipalities Fund grew from €27.3 billion in 2015 to €42.2 billion in 2023 and will continue to grow to €49.1 billion in 2029 — an average increase of €1.6 billion a year, structurally. Municipal spending per resident rose from €3,822 in 2023 to €4,650 in 2025 — an increase of 22 per cent in two years. Total municipal budgets in 2025: €80 billion, double the level of around 2010. Add the provinces and central government, and there is no law saying: this is the norm per resident; this is where it stops.
Three levels without a brake
| Level of government | Brake? | Effect |
|---|---|---|
| Central government | None | Zalm standard abandoned, no constitutional limit, 60% EU norm not made binding. |
| Provinces | None | Provincial fund grows unchecked, no spending norm per resident. |
| Municipalities | None | €3,822 → €4,650 per resident in two years (+22%). Budget doubled since 2010. |
| Germany (federal) | Yes: 0.35% of GDP | Constitutionally enshrined since 2016. Enforceable by the Federal Constitutional Court. |
It is not that we have made mistakes. We have systematically chosen not to make choices. That is the most fundamental difference between us and Germany — and that is where our real debt lies. But what we have neglected, we can repair today.
Part III bis — The forbidden question
What if we turn the gas back on and build South Groningen?
As long as we are making an honest admission, we must also dare to ask the most controversial question: what happens if the Netherlands reopens its gas sources and finally compensates the people of Groningen generously? This has become politically taboo — and precisely for that reason it must be brought into the open. Not out of nostalgia, but to demonstrate that even this most wishful-thinking solution does not work without the other reforms.
What is still in the ground?
The hard geological facts: the Groningen field was permanently closed in April 2024, but still contains ~470 billion m³ of recoverable gas. The small fields on land and in the North Sea contain ~71 billion m³ of proven reserves, with TNO estimates adding 115 to 150 billion m³ of geological potential. EBN director Van Hoogstraten stated in April 2025: "There is still at least 100 Bcm of gas under the Dutch North Sea. This natural gas can make a major contribution to our energy independence.". Altogether: 400 to 770 billion m³ — depending on how aggressively reopening and exploration are pursued. The Groningen reserves alone are worth approximately €174 billion gross at a gas price of €37/MWh — nearly one-sixth of current annual GDP.
And that is the cautious estimate. In September 2025, SEB Research put the average TTF price for 2025 at €38.7/MWh, with a forecast of €34/MWh for 2026 and €30/MWh for 2027 once the LNG wave from the US, Qatar and Canada arrives. At the same time, however, SEB warns of "higher for longer" through 2025–26: tight winter supplies, storage levels lagging behind last year, Norwegian supply limited by maintenance, and Asian restocking tightening the Atlantic market. Every step back in Russian LNG imports to Europe pushes prices higher still. And every new well drilled in the Dutch North Sea increases recoverable reserves. The question is therefore not whether the reserves will be worth more than we currently think — but how much more.
Four scenarios calculated
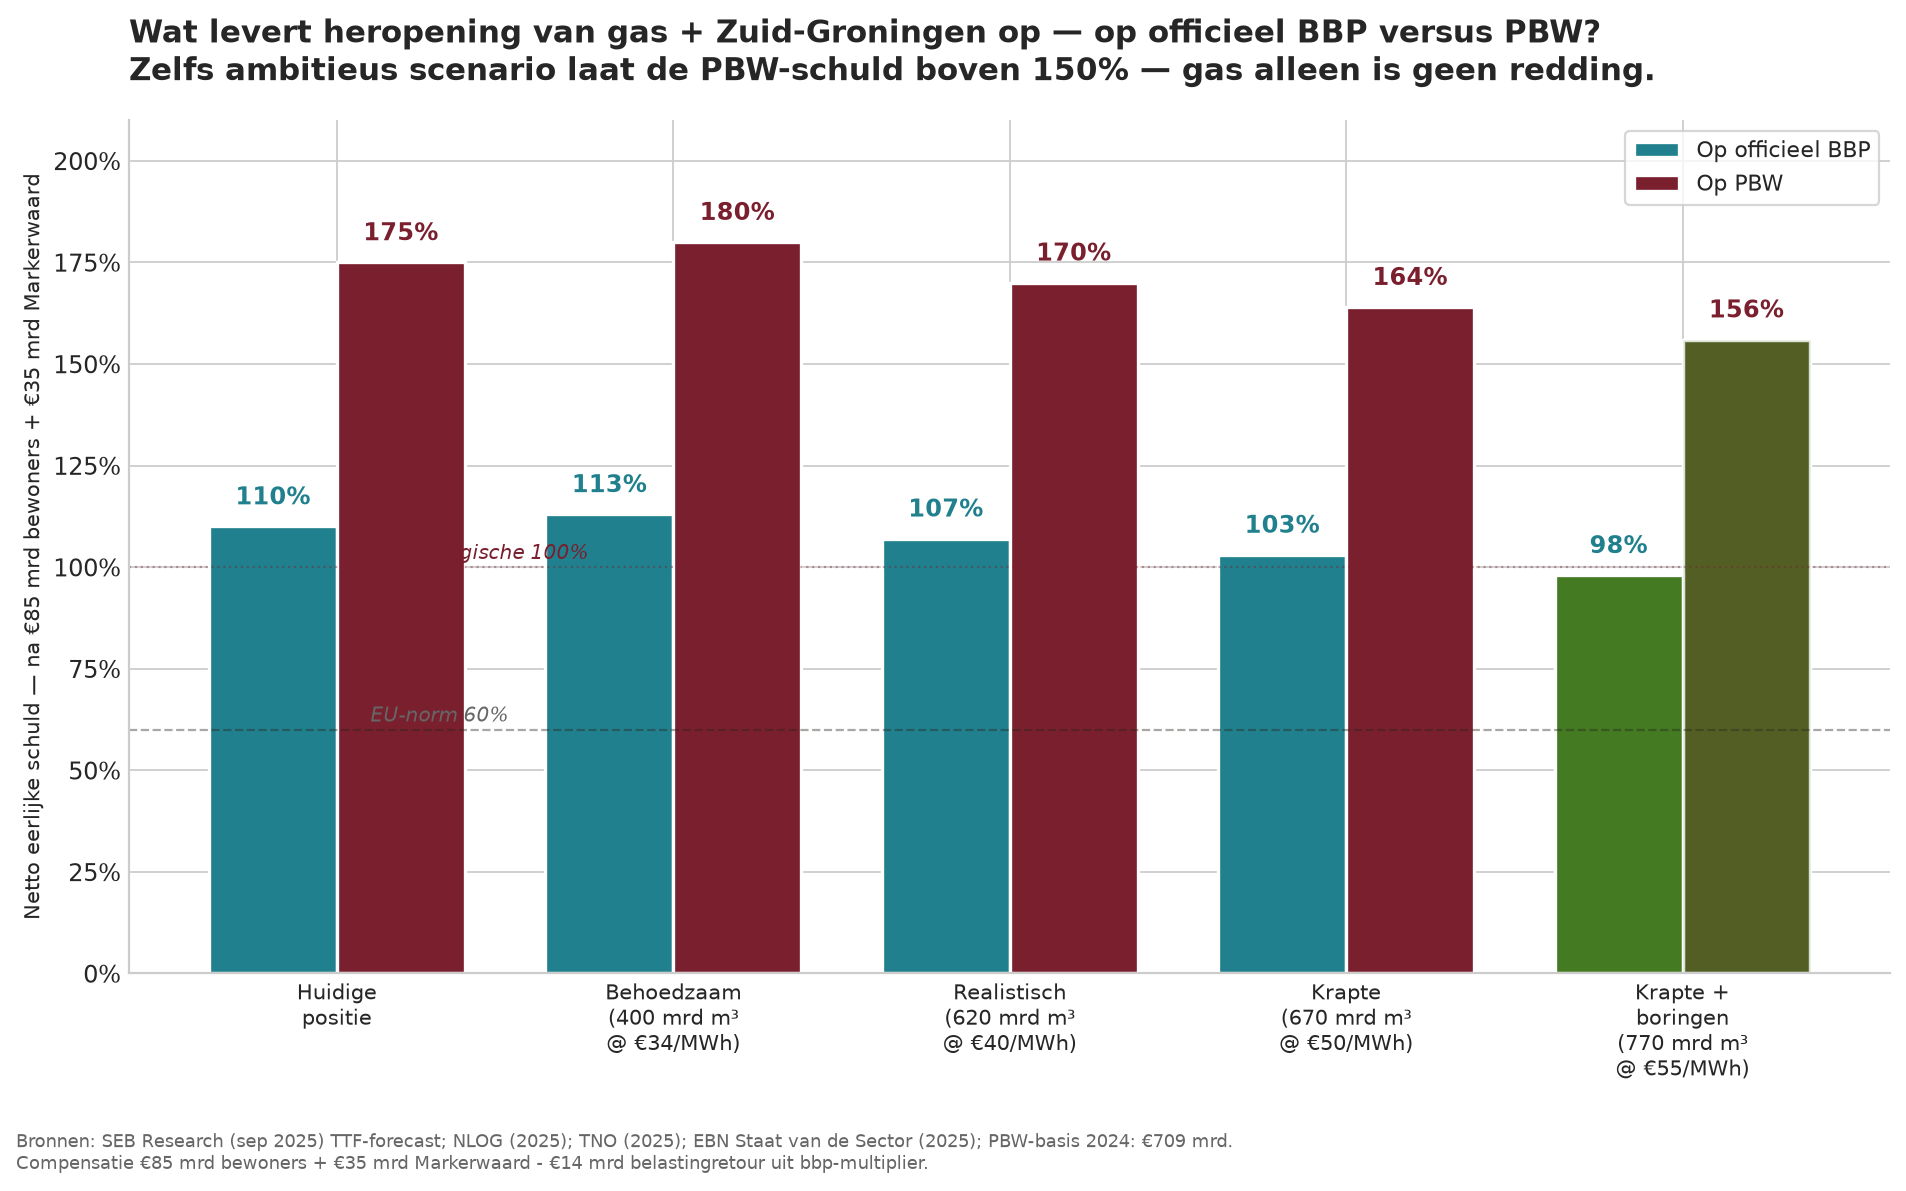
The calculation is as follows. Historically, the Dutch state collected approximately 70% of gross gas revenue through mining rights, royalties, EBN participation and corporation tax. With extraction costs of 20% and the historical distribution key, the state’s net proceeds amount to gross revenue multiplied by 0.56. Deduct the €85 billion residents’ compensation plus the €35 billion Markerwaard investment, and add the €14 billion tax return from the GDP multiplier; the result is:
| Scenario | Volume | Gross revenue | Net to state | Debt GDP / PBW |
|---|---|---|---|---|
| Cautious (400 billion m³ at €34/MWh) | 400 billion m³ | €136 billion | −€30 billion | 113% / 180% |
| Realistic (620 billion m³ at €40/MWh) | 620 billion m³ | €248 billion | +€33 billion | 107% / 170% |
| Tight supply (670 billion m³ at €50/MWh) | 670 billion m³ | €335 billion | +€82 billion | 103% / 164% |
| Tight supply + drilling (770 billion m³ at €55/MWh) | 770 billion m³ | €424 billion | +€131 billion | 98% / 156% |
Calculation: 10 kWh/m³ calorific value; 70% government share of gross revenue less 20% extraction costs; €85 billion residents + €35 billion Markerwaard − €14 billion tax return.
Southern Groningen — the circular deal
Until now, this has been only about money returned to the Treasury. But the real breakthrough lies elsewhere. Somewhere on the northern flank of the Randstad, 40,000 to 60,000 new homes need to be built — a modern, decarbonised city that will be called Southern Groningen. This turns the gas deal from a payment made at a distance into a concrete move to a new home in a new region — financed from the same subsoil.
Three possible locations
There are three serious options, each with its own advantages and disadvantages. The choice is a political decision that must be made on the basis of an environmental impact assessment, IJsselmeer hydrology and Natura 2000 integration. But the options are there:
- Option A — Markerwaard (60,000 ha). The fourth IJsselmeer polder, abandoned in 1986. The greatest capacity (up to 60,000 homes plus agriculture and industry), but also the most far-reaching intervention in the IJsselmeer system and the highest land-reclamation costs (~€15–20 billion). Full implementation would take 15–20 years.
- Option B — Expansion of Almere Pampus and the IJmeer polder. Almere already has concrete plans for 7,500 homes in Pampus, with an IJmeer connection to Amsterdam. Expansion to 40,000–50,000 homes through adjoining reclamation of the southern IJmeer. Fastest start (existing planning), lower reclamation costs (~€8–12 billion), but a smaller maximum capacity than Markerwaard.
- Option C — Wieringermeer expansion towards the Afsluitdijk. Adjoining the existing Wieringermeer polder in North Holland. Spatially the most logical option for the Northern Netherlands economic corridor, and closer to the gas fields. Smaller scale (20,000–30,000 homes), but the fastest political route and the best connection to existing infrastructure.
My preference is for a combined B+C route: Almere Pampus as the first tranche (starting 2026–2030), and Wieringermeer expansion as the second tranche (2028–2035). Together, approximately 65,000 homes, spread across two locations so that the housing market and construction sector are not overloaded. Markerwaard remains an option for a possible third phase after 2040. Total reclamation costs: ~€20 billion — exactly the budget included in the scenario.
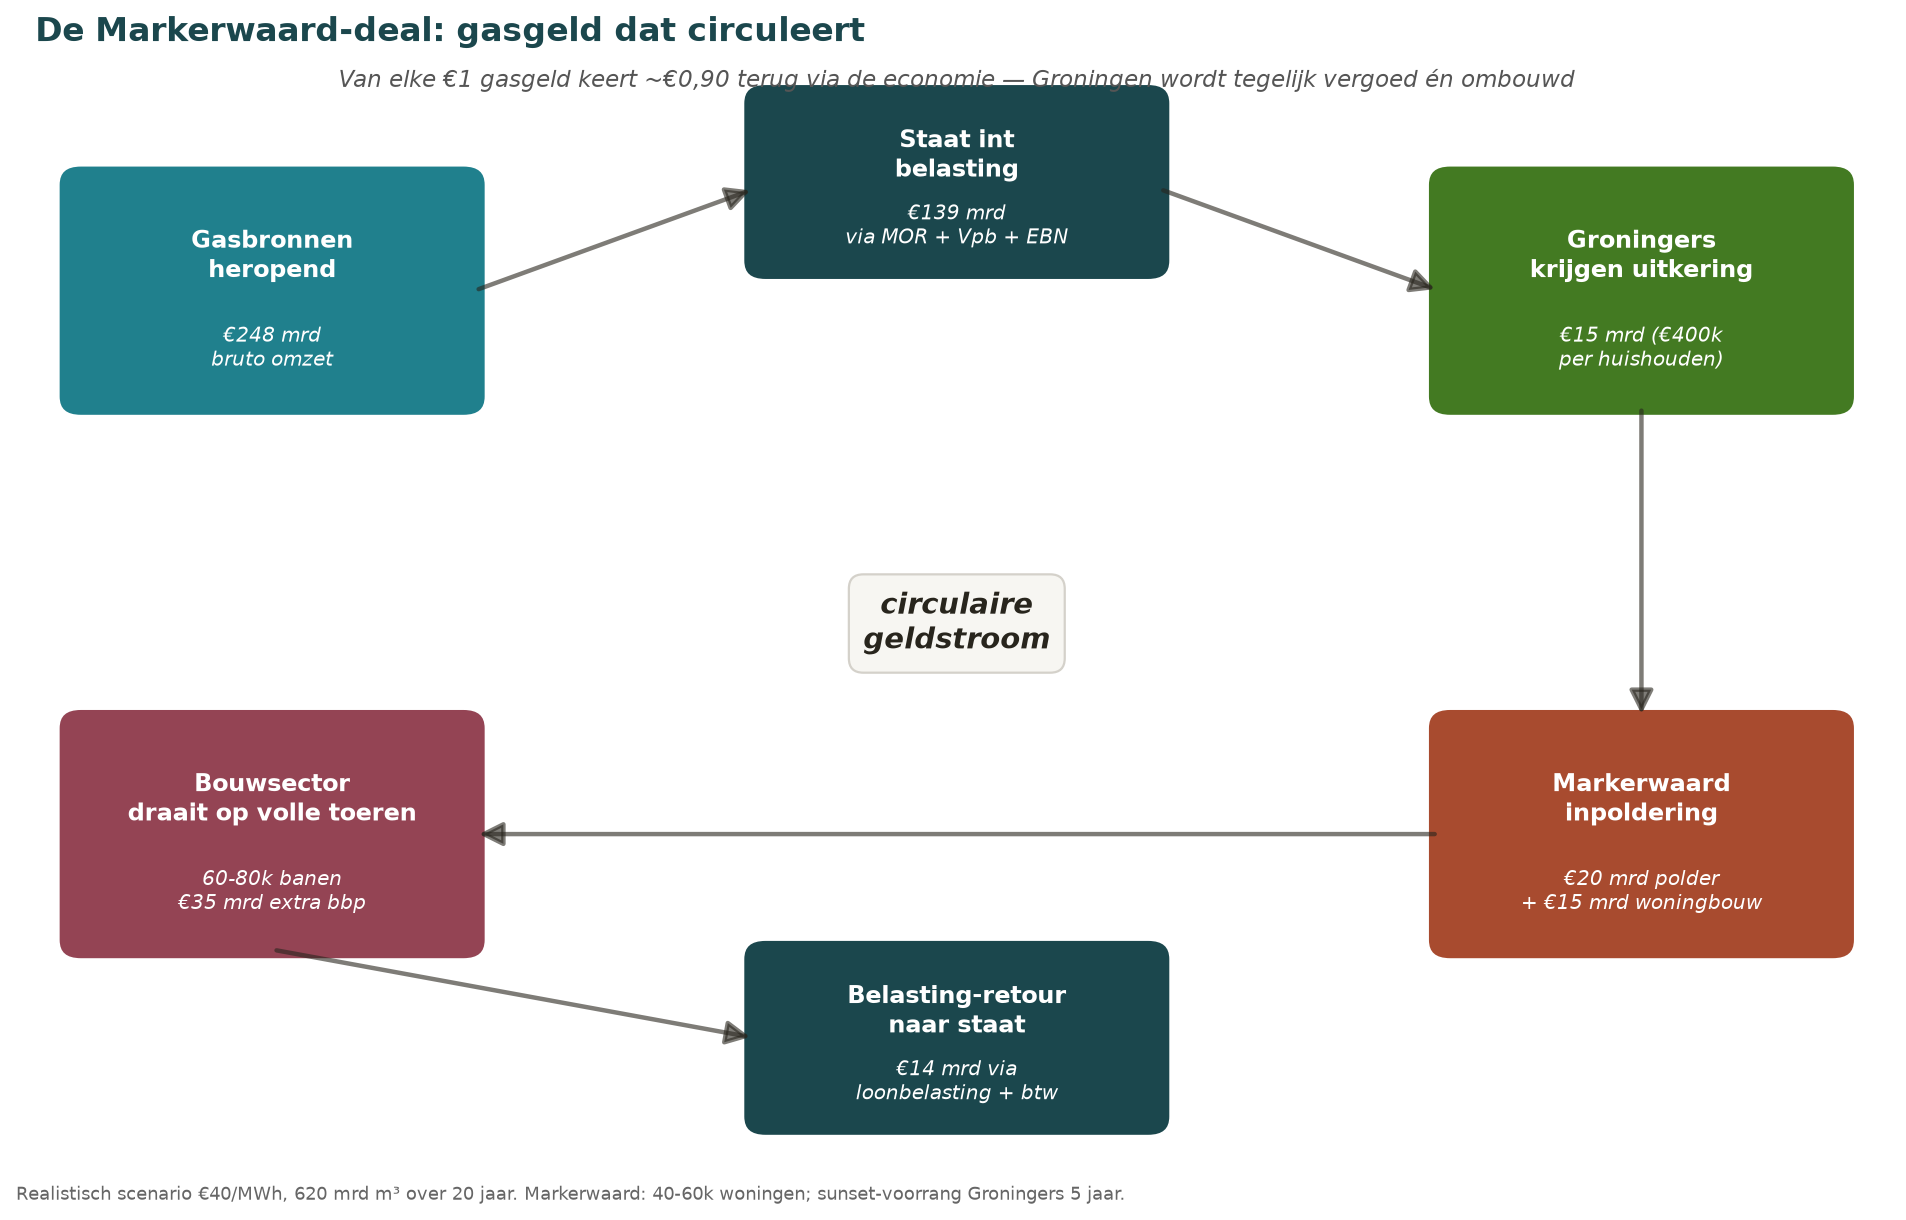
What makes this fundamentally different from a conventional compensation payment is the multiplier that runs through the construction sector. When a Groningen family receives €400,000 and spends it on a new-build home in Markerwaard, the money goes to Dutch contractors, Dutch employees and Dutch suppliers. Income tax, VAT, corporation tax and employers’ social-security contributions flow back to the state. The CPB estimates a multiplier of 1.3–1.5 for construction investment and a tax burden of 40% — meaning that of the €35 billion in additional GDP generated by the Markerwaard project, approximately €14 billion flows back to the Treasury as tax.
More importantly, the project addresses three crises at once. Housing crisis — 40,000 to 60,000 new homes represents approximately 5% of the national shortfall. Construction sector — 60,000 to 80,000 jobs over 10 to 15 years, in a sector currently contracting because of the nitrogen crisis and the interest-rate shock. Trade balance — 30 billion m³ of domestic gas plus domestic construction would structurally replace €40 billion in annual imports. Add to this the fact that Dutch industry — Chemelot, Rotterdam, Tata — would once again have access to competitively priced gas, and the whole is greater than the sum of its parts.
The differentiated sunset principle
The priority arrangement for people from Groningen does not last equally long for everyone. Those living in the core area (Zone 1) receive seven years’ priority for homes in Southern Groningen — because they have suffered the most severe damage and face the most complex relocation challenge. Those in the peripheral area (Zone 2) receive five years’ priority — the standard sunset period. Those in the outer area (Zone 3) receive three years’ priority — because the damage is more limited and the pressure to relocate lower. Everyone receives a first right to buy, a 20% price discount and a relocation budget in addition to their individual compensation.
After these periods, priority expires and the remaining homes become available to all Dutch people — under the normal allocation rules. That is the sunset principle: recovery is temporary, equality is permanent. Differentiation ensures that those who have suffered most are given the greatest amount of time to move.
This principle should be introduced across Dutch policy. Remedial measures — whether concerning Groningen, the Benefits Scandal, the colonial legacy or other historic injustices — should always have a clear end date, differentiated according to the severity of the injustice suffered. Not out of parsimony, but out of respect for equality before the law. A priority arrangement without a sunset becomes a new injustice. A sunset without substantial priority is not genuine redress. A sunset without differentiation is a blunt instrument. All three must go together. This proposal makes that explicit.
Four honest truths
- Gas is not a solution to the debt. Even fully reopening production would yield the state only 1 percentage point of GDP per year at the mid-range price over 15–20 years. By then, implicit debt caused by population ageing will have risen by more than €100 billion. Gas is racing against ageing — and losing.
- Gas is a solution for Groningen. The €85 billion residents’ compensation in my scenario is differentiated according to damage intensity (see table below). It is properly financed from its own proceeds. No tax increase is required. This is a fundamentally different scale from the current fixed compensation.
- Gas is a solution for industry and the housing crisis. This is often forgotten. 30 billion m³ a year of domestic production means Dutch industry receives gas below the EU market price, dependence on imports from Russia, Qatar and the US falls sharply, the chemicals cluster (Chemelot, Rotterdam) remains viable, and the trade balance improves structurally by €40 billion a year. And the Markerwaard reclamation would give the construction sector — currently contracting — a decade of work and provide the Netherlands with 40,000–60,000 additional homes.
- Gas is the bridge, not the destination. According to TNO, North Sea production will end in 2035 without investment. Reopening production would extend this to 2050–2055 — 25 years in which to build nuclear capacity (Borssele 2 and 3, SMRs), establish hydrogen infrastructure and modernise industry without forced relocation.
Differentiated compensation — damage determines payment
A flat payment of €400,000 per household is politically simple but deficient in terms of justice: someone with a cracked foundation and a lengthy strengthening programme deserves more than someone with merely cosmetic cracks. Research by TU Delft has mapped the damage categories in the earthquake-affected area. On that basis, the amount varies by zone:
| Zone | Characteristic | Households | Payment per household | Total |
|---|---|---|---|---|
| Zone 1 — Core area | Heavily damaged and reinforced homes | ~10,000 | €600,000 | €6.0 billion |
| Zone 2 — Peripheral area | Multiple damage cases | ~15,000 | €400,000 | €6.0 billion |
| Zone 3 — Outer area | Individual damage cases or loss of value | ~10,000 | €300,000 | €3.0 billion |
| Total | ~35,000 households | 35,000 | average €428,500 | €15.0 billion |
Zone indication: based on the TU Delft classification (2016); final boundaries to be established by an independent commission. Compensation indexed and paid over 25 years.
The differentiated approach: €600,000 in the core area (10,000 households with severely damaged or reinforced homes), €400,000 in the surrounding area (15,000 households with multiple damage incidents), €300,000 in the outer area (10,000 households with isolated damage or loss of value). A total of 35,000 households, averaging €428,500 — exactly the amount included in the overall calculation. This ensures that the most severely affected resident receives the most, while the surrounding area also receives substantial compensation without the core area suffering as a result. The definitive zone boundaries will be established by an independent commission on the basis of objective damage data.
Constitutional conditions — five safeguards
The people of Groningen no longer trust the state — and rightly so. Every promise that “the proceeds are for you” is heard against the backdrop of sixty years of broken promises. When we collected €417 billion in natural gas revenues between 1963 and 2021, while Groningen saw less than 1% of it returned, making another promise without firm guarantees is politically impossible.
The only responsible course, therefore, is the constitutional enshrinement of five principles before a single tap is opened:
- All net proceeds to the Groningen Fund. Not a single euro to general government funds. Management according to a strict Norwegian GPFG model, with a binding rule that no more than 3% of the fund’s value may be withdrawn each year — and only for investment in the region and the energy transition.
- A differentiated payment per household enshrined in law. No political adjustment afterwards. €600,000 (Zone 1) / €400,000 (Zone 2) / €300,000 (Zone 3), indexed and paid over 25 years. Definitive zone boundaries to be determined by an independent commission. Comparable to the Alaskan Permanent Fund Dividend — what has been promised will be paid.
- Veto power for the province. Every production decision requires the consent of the province of Groningen and the municipal councils in the earthquake-affected area. No more unilateral decisions from The Hague. If the residents say “no”, the gas remains in the ground.
- The gas–housebuilding link constitutionally enshrined. No gas production without the simultaneous start of housebuilding in South Groningen (Markerwaard, Almere Pampus or Wieringermeer). No housebuilding without gas revenues. The two decisions become a single package — so that neither the gas revenues can disappear into general government funds, nor the housebuilding promise be detached and diluted into a token gesture.
- A differentiated sunset principle established in law. Priority will not last equally long for everyone. Zone 1 (core area): seven years of priority — they deserve the longest transition period, because their damage is greatest and their logistical challenge (decommissioning a damaged house and building a new one) is the most complex. Zone 2 (surrounding area): five years of priority — the standard sunset period. Zone 3 (outer area): three years of priority — their damage is more limited and they generally face less pressure to relocate. After these periods, priority will automatically lapse and the remaining homes will be opened to all Dutch citizens. Comparable to the Alaska Permanent Fund Dividend: what has been promised will be paid — what has not been promised will not be quietly added.
“We should have done this forty years ago. What Norway did, we failed to do — and the bill was passed on to Groningen. If we now want to extract gas again, that mistake must first be repaired constitutionally.”
What the scenario teaches us
The gas scenario, linked to the South Groningen land-reclamation project, is more than an additional lever — it is a circular deal that addresses four crises at once. At a realistic TTF price, net fair debt falls by 3 percentage points of GDP and 5 percentage points of PBW; under a tight-market-plus-drilling scenario, by 12 and 19 percentage points respectively. On top of this come up to €600,000 per Groningen household in the core zone, 40,000 to 60,000 new homes, 60,000 to 80,000 construction jobs, and a structurally improved trade balance. The effect is too significant to dismiss without substantive debate — but at the same time it is no miracle solution: even in the best-case scenario, net fair debt remains above 150% of PBW. That makes the admission and the reforms all the more necessary.
But it is emphatically not an alternative to honest accounting, a debt brake or a Truth Commission. It is an addition to them. Anyone who says “no more gas, no reforms” is selling the same deception as anyone who says “no admission, we did everything right”. Both turn a blind eye to the bill that exists. The gas + Markerwaard scenario works only after the admission, embedded in the Truth Commission and bound by constitutional sunset clauses. Otherwise, it becomes once again what it became in 1963: a major debt loaded onto the wrong shoulders.
Conclusion — The invitation

Why an admission is not weakness but the beginning of cooperation with those we still regard as opponents
The four-step invitation
No reform will command support while the figures remain dishonest. Without an admission, there is no mandate for painful measures. Gerhard Schröder did it in March 2003 with his Agenda 2010 — it cost him power personally, but Germany reaped the benefits for fifteen years. The Dutch counterpart has been absent since Wim Kok. But in 2026 we have something Schröder did not have in 2003: €1,750 billion in pension assets as proof that we can bear the burden, and the lowest net fair debt among comparable European countries. We therefore do not come to the admission empty-handed — we come with an invitation.
- Step 1 — Acknowledge the four layers and the denominator. 44% is not a lie, but it is a quarter of the story. The true net fair burden is 110% of official GDP — and 170% of PBW, the real productive base. Both must be explicitly named — not as an attack but as reality. Without PBW alongside GDP, we are steering by a cockpit instrument that fails to register the engine trouble.
- Step 2 — Acknowledge shared complicity. Trade unions have made wage demands on the basis of 44%. Employers have postponed investment because they were not given the real figures. Municipalities have built budgets on implicit government promises that were never funded. Coalition governments have systematically passed the buck. We have all been steering by the wrong figures — myself included. That suddenly turns “enemies at the table” into people in the same boat.
- Step 3 — Publish a corrected national annual report in accordance with German standards: four-layer debt, implicit obligations made explicit, Sondervermögen-like structures transparently ring-fenced, and expenditure per resident by tier of government. Publish it before Budget Day, independently of the cabinet, and make it binding for all negotiating tables that year.
- Step 4 — Introduce a Dutch debt brake at constitutional level, plus expenditure standards per resident for central government, provinces and municipalities. Binding. Enforceable by the Supreme Court. And — crucially — drawn up in consultation with trade unions, employers’ associations, the Association of Netherlands Municipalities, the Association of Provinces of the Netherlands and the opposition. Not imposed by a coalition.
The great enemies are now the great allies
This is the heart of the invitation. As long as the figures are dishonest, every negotiation is a zero-sum game — if the trade union wins, employers lose, and vice versa. Once the four layers are on the table, the game changes: trade unions and employers suddenly share the same interest — not passing the burden on to their members’ children. Industry suddenly shares the same interest as the labour movement — the €1,750 billion pension fund is, for both sides, the guarantee that the Netherlands can invest without a crisis. Municipalities suddenly share the same interest as central government — a debt brake protects them against unfunded devolution of responsibilities.
The dynamic changes even with European partners. If the Netherlands honestly presents its 110% while also showing its 159% buffer, the discussion in Brussels is no longer “The Hague lecturing us”. It becomes: “If the Netherlands dares to do this, then so must we.” France, Belgium, Italy, Spain and Greece cannot politically take the first step — their figures are too stark. We can. That is not their weakness — it is our responsibility as an honest broker.
Institutional action: a Truth Commission on Government Accounting
Specifically, I propose a Dutch Truth Commission on Government Accounting — modelled on German and Swedish practice — with a statutory reporting obligation covering:
- The four layers of public debt (EMU, committed, implicit gross, net after countervailing assets).
- Future climate and clean-up obligations — offshore wind, onshore wind, solar PV, hydrogen and battery storage.
- Expenditure per resident by tier of government, compared annually with OECD benchmarks.
- Industrial competitiveness: energy prices, labour costs, net effective tax burden compared with competing countries.
- European comparison of the four layers — the Netherlands as an honest broker in EU reforms.
This commission must be politically independent, with a mandate comparable to that of the Netherlands Court of Audit, but broader — including implicit obligations. Its report must be published by law before every Budget Day, and the cabinet must not be permitted to amend it. Trade unions, employers, the Association of Netherlands Municipalities, the Association of Provinces of the Netherlands and the EU should have seats on the supervisory board. Then we will have an institution that makes the conversation possible rather than blocking it.
We must get to work — together
We must not leave our children a 110% net national debt that is on course to reach 200% or more. That means my generation, and the generation above me, must work harder, work longer, and consume more wisely — not because a politician says so, but because the arithmetic says so. And because we love our children. Every Dutch person understands “aan de bak”: it is direct, practical and un-Hollywood-like. But aan de bak means something different in 2026 than it did in 1948. It does not mean: working harder for less pay. It means: calculating more honestly together, investing more intelligently together, standing stronger in Europe together.
“We must get to work. Not out of penance, but because we love our children. And not alone — but together with those whom we still see as enemies today, but will recognise as allies tomorrow.”
This is not a party-political attack
Every coalition since 2002 has contributed to passing the burden on. Balkenende I to IV. Rutte I to IV. Schoof. This three-part article is therefore not an indictment of any one party — it is an indictment of a system in which it has become politically impossible to tell the truth without immediately losing the next election. That is precisely the system that must be broken. And that can happen only if a broad coalition of trade union leaders, industrial entrepreneurs, municipal aldermen, opposition parties and citizens jointly says: enough. We want honest figures. We want to get to work. We do not want to saddle our children with this bill. And we want to do it together — with whoever is willing.
That is the invitation. Whoever accepts it opens the door to the first genuinely honest Dutch period of government since Wim Kok. Whoever refuses it chooses to make our children pay the bill — and sooner or later will have to explain that to their own grandchildren.
Honesty makes governing possible
As long as we conceal reality, every negotiation is a shadow play — and we all lose, including those who think they are making gains in the short term.