The World Belt — climate plan 2040-2050
425 corridor segments scientifically modelled. 290 profitable at €40 per tonne of CO₂. Climate-neutral by 2040, at least 50% net negative by 2050 — with 840,000 new jobs in Europe and future prospects in Africa.
Jacobus van Merksteijn
The climate problem no longer needs an ideological solution. It needs a differentiated blueprint, built around hectares, tonnes of CO₂ and euros per tonne. This newspaper has carried out that calculation for 425 corridor segments of 100 km around the Sahara, along the Andes, across northern Australia, through Anatolia and along the Russian and Kazakh steppes. What emerges is a strategy that breaks three taboos at once: it identifies which areas are uneconomic and should therefore be skipped, it demands no sacrifice but offers 840,000 new jobs in Europe, and it gives asylum seekers a concrete future in Africa that our own democracy cannot offer them.
The question is not “can we do it?”, but “where and how wide?”
Fifteen years of climate debate have kept the discussion focused on the same questions — how much must we cut, how quickly, and who bears the costs. The inverse question is rarely addressed: how much CO₂ can the Earth absorb again using existing industrial means, and what does it cost per tonne? This newspaper has calculated that for 425 specific locations, each 100 kilometres long, in sections 100 kilometres wide. Each segment was assessed in terms of temperature, rainfall, dew, field size and machinery deployment.
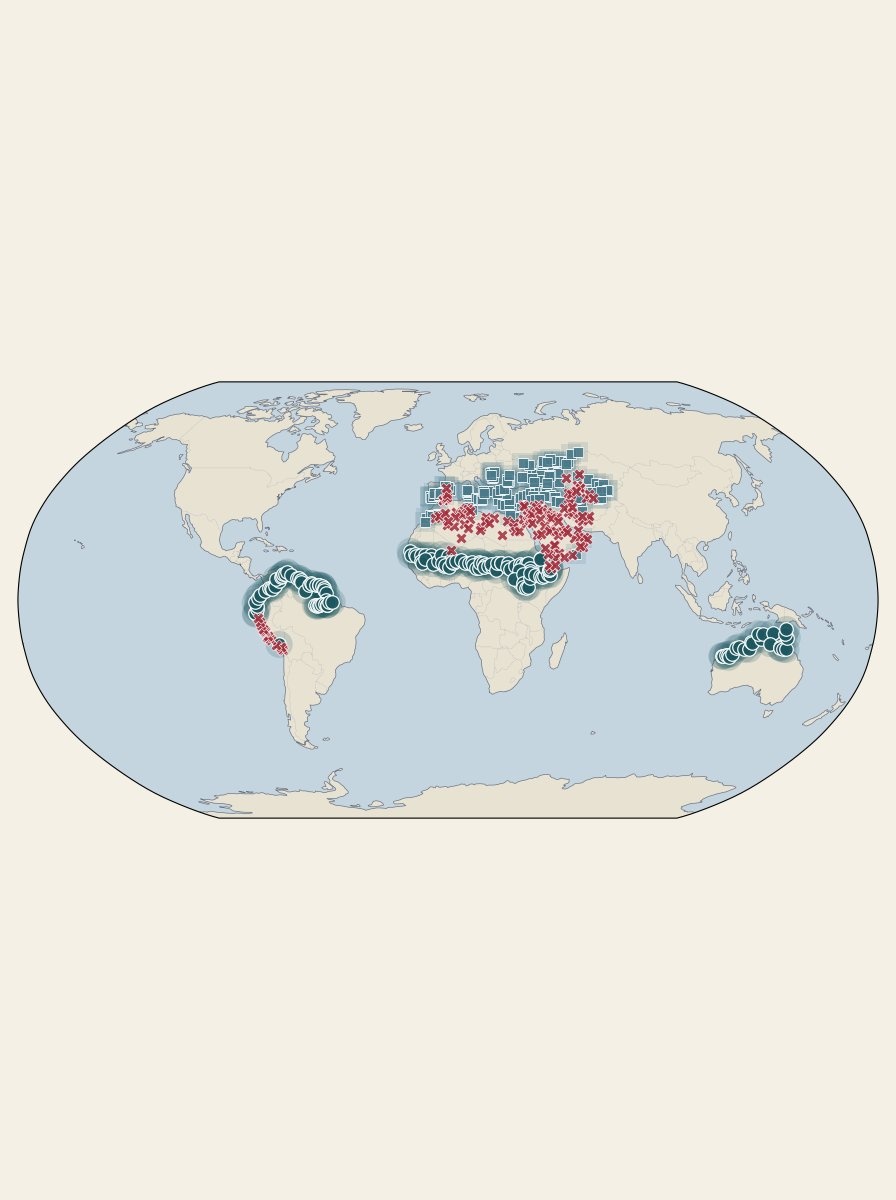
The outcome is disarmingly simple. Of the 425 zones, only 290 prove genuinely profitable at a market price of €40 per tonne of CO₂. The remaining 135 zones have a cost above €40. They are marked with a red cross on the map. They are all located in areas that are too dry or too fragmented: the Egyptian interior, the Levant, parts of the Arabian Peninsula, and the most fragmented parts of southern Europe.
Expanding profitable zones delivers greater climate impact per euro invested than extending into unprofitable zones. That may seem self-evident. Yet no climate organisation has ever put it that way.
The answer is differentiated — 30 km here, 600 km there
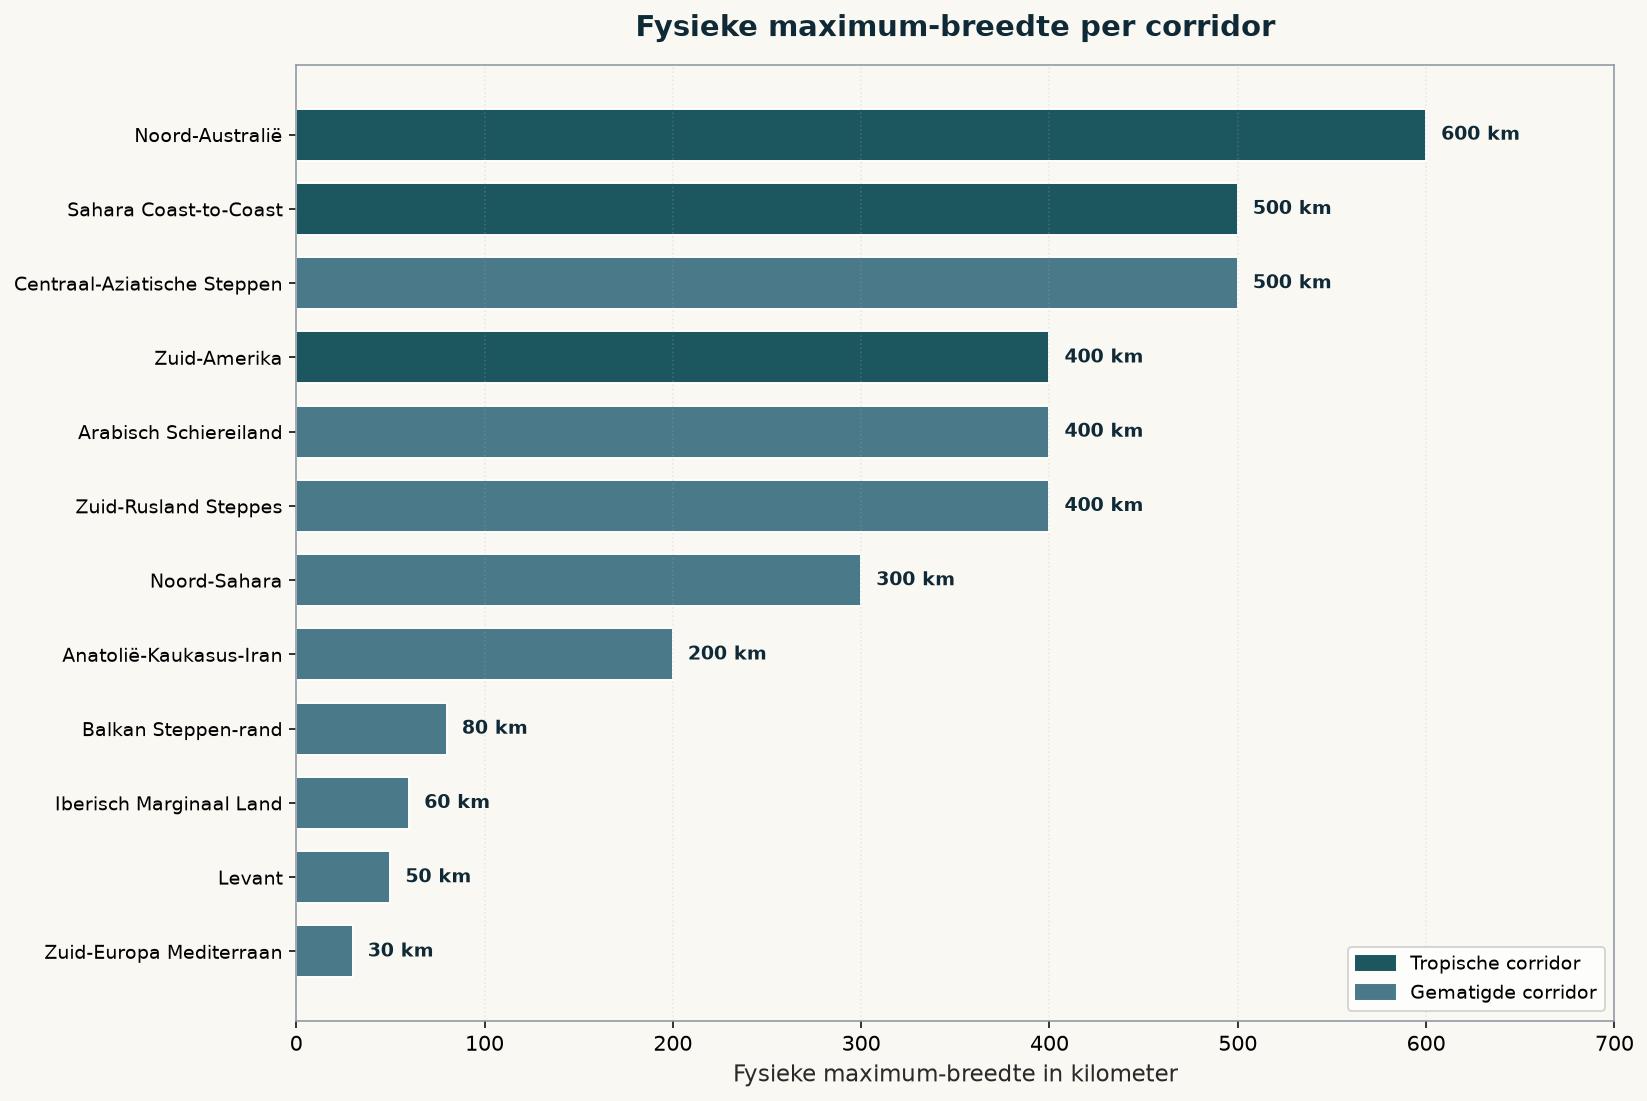
Climate plans like to speak in terms of a single figure. This study cannot do so. The physical maximum width per corridor varies by a factor of twenty: from 30 kilometres in southern Europe (fragmented by villages, olive groves, vineyards and the sea) to 600 kilometres in the Australian Top End (empty as far as the horizon, with Aboriginal cooperation). Each corridor is given precisely as much width as its geography permits.
| Corridor | Max width | Max CO₂ Gt/year | Cost | Limiting factor |
|---|---|---|---|---|
| Northern Australia | 600 km | 13.4 | €10.53 | Top End empty, Aboriginal Land Use Agreements |
| Sahara Coast-to-Coast | 500 km | 24.9 | €14.49 | Southern edge of the Sahara from Mauritania to Djibouti |
| South America Andes-Amazon | 400 km | 29.1 | €7.50 | Foothills; not in rainforest |
| Southern Russian Steppes | 400 km | 5.1 | €17.68 | Soviet legacy of large blocks |
| Central Asian Steppes | 500 km | 2.8 | €26.44 | Kazakh steppes, little habitation |
| Anatolia-Caucasus-Iran | 200 km | 2.3 | €20.74 | Fragmented highlands, settlement in valleys |
| Arabian Peninsula | 400 km | 0.8 | €23.24 | Water is the limiting factor, despite the Rub al-Khali |
| Northern Sahara (Morocco-Egypt) | 300 km | 0.8 | €32.62 | Political fragmentation in Libya and Egypt |
| Balkan Steppe Fringe | 80 km | 0.6 | €22.06 | Marginal plateaux between agricultural land |
| Iberian Marginal Land | 60 km | 0.5 | €29.83 | Fragmented by villages |
| Levant | 50 km | 0.09 | €28.59 | Political instability, dense settlement |
| Southern European Mediterranean | 30 km | 0.4 | €30.61 | Heavily fragmented by villages and the sea |
| TOTAL | varies | 80.8 | weighted €14.91 | Physical maximum worldwide |
The average cost across all 290 profitable zones at a base width of 100 km is €14.91 per tonne of CO₂. South America is the most favourable at €7.50; southern Europe the most expensive at €30.61. This is not a political choice but physics: photosynthetic efficiency is temperature × light × water. In the tropics, all three are present throughout the year; in Europe, only for five to seven months.
The 2040 and 2050 targets — at market prices no one needs to explain away
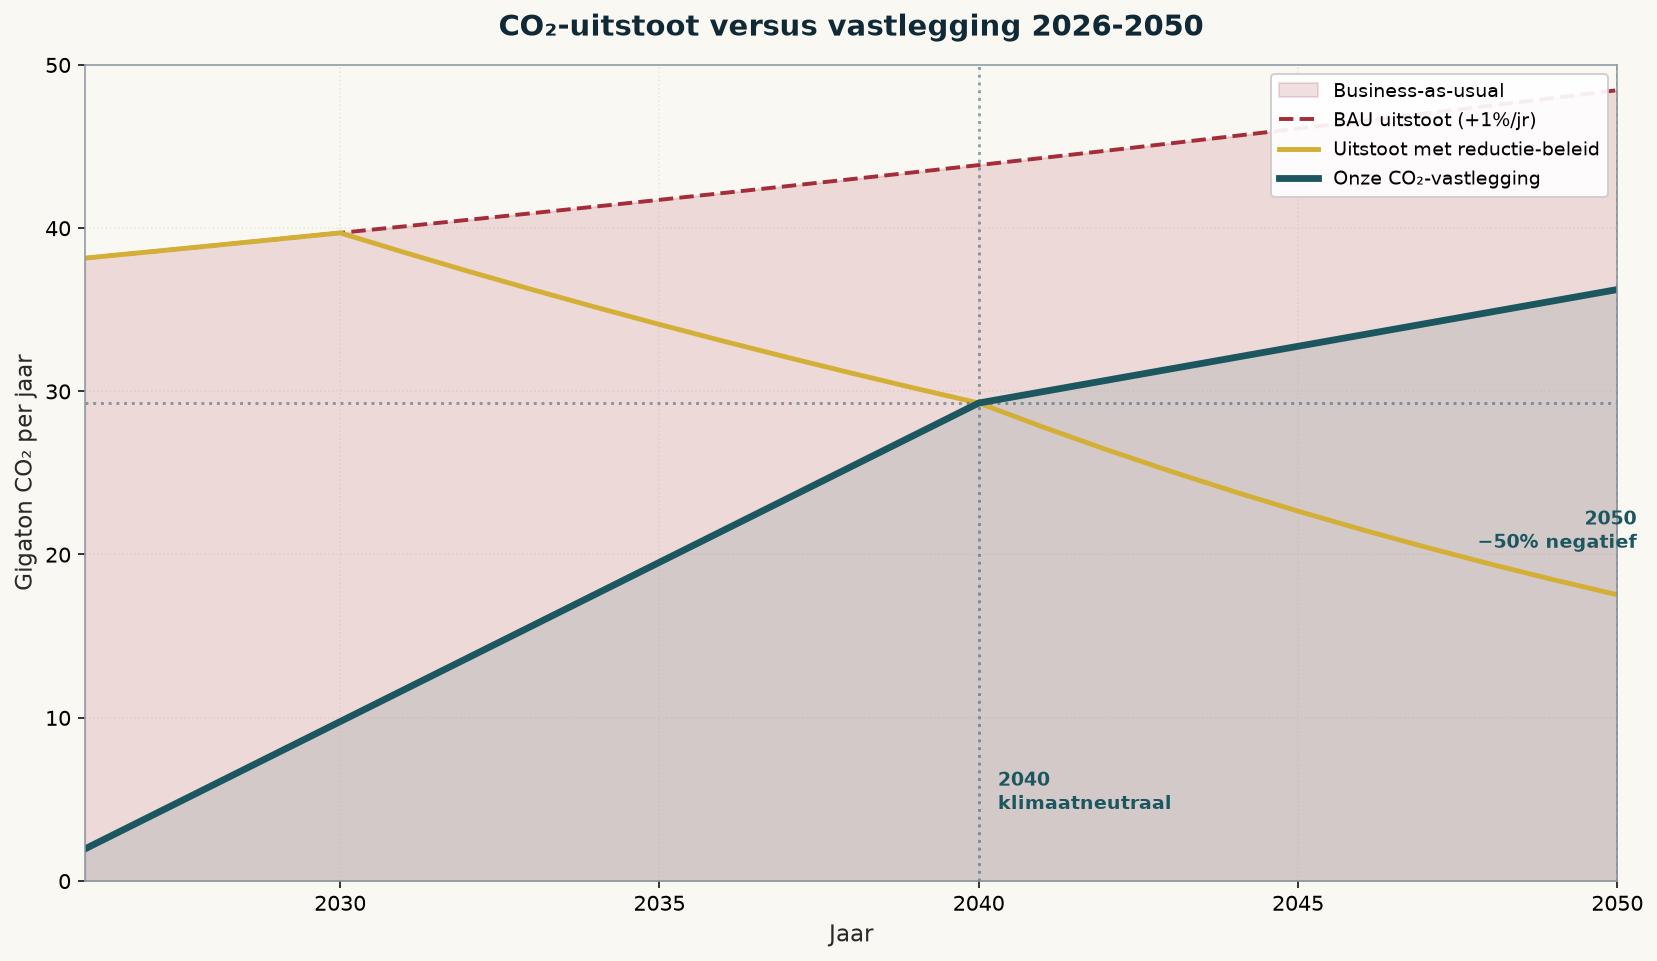
If global CO₂ emissions, under realistic reduction policies, fall from 37.4 Gt in 2024 to 29.3 Gt in 2040 and 17.5 Gt in 2050, our sequestration in 2040 must compensate for at least 29.3 Gt to achieve climate neutrality. For 2050, at least 25% negative means 26.9 Gt must be removed annually; for 50% negative, 36.2 Gt per year.
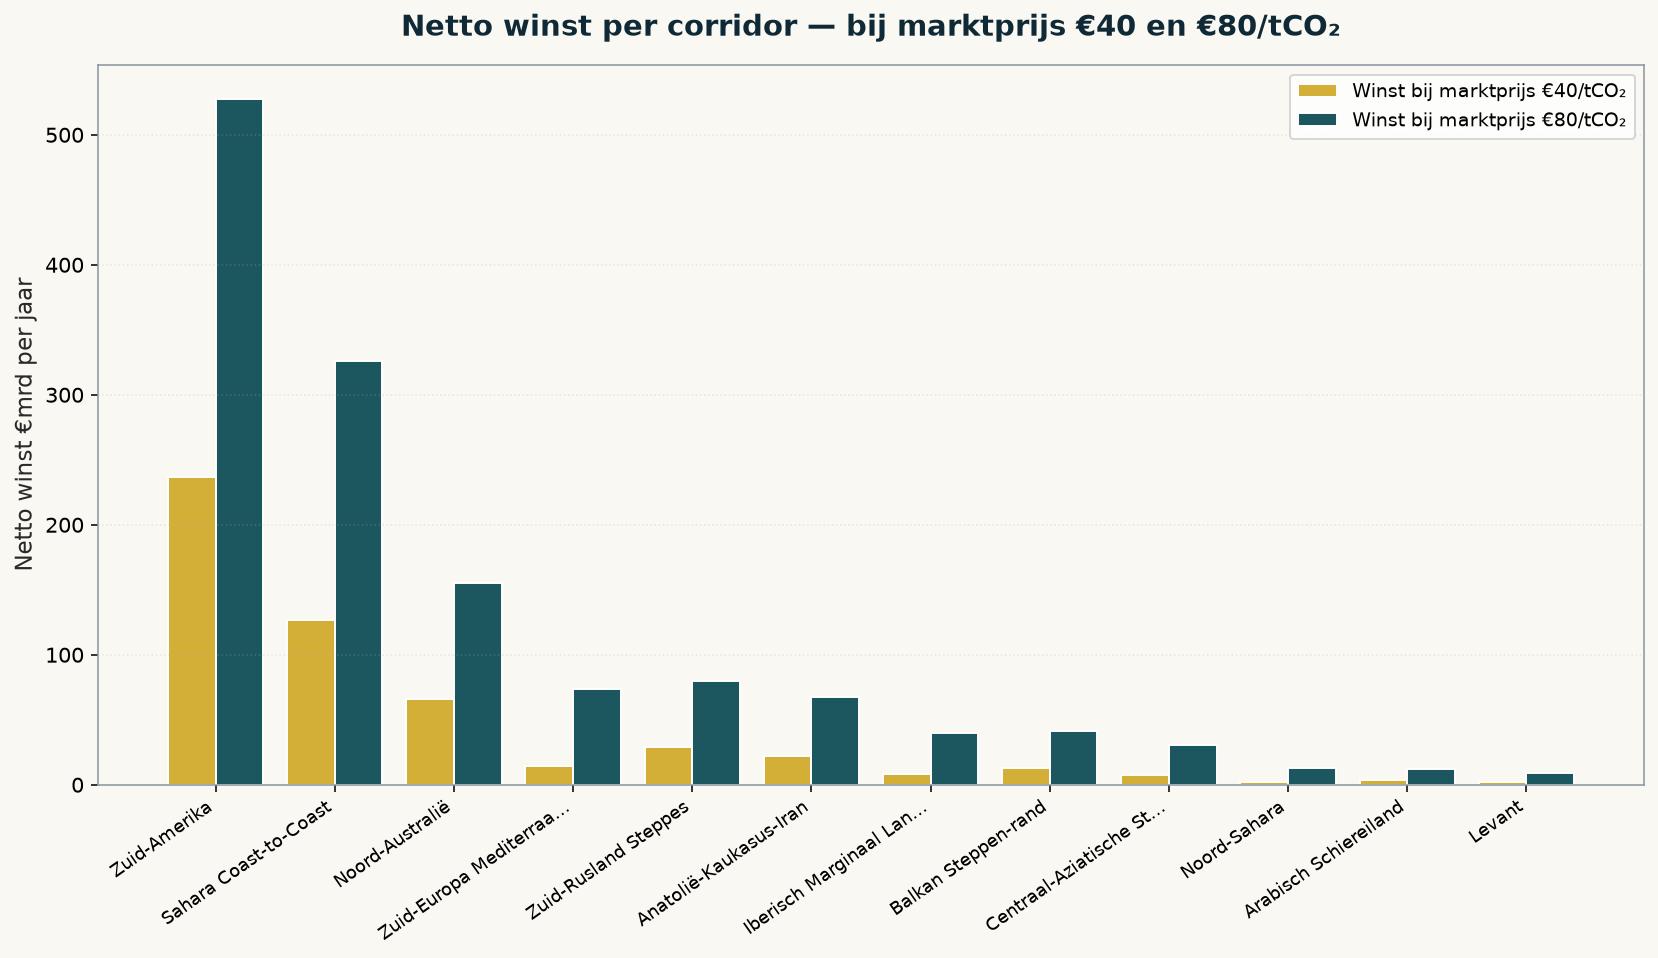
The market price for CO₂ removal is currently between €40 and €80 per tonne. This market price is retained in the plan — no price pressure, no dumping. At a market price of €40, the net margin across the 290 zones is €25.09 per tonne; at €80 it is €65.09 per tonne. The resulting profit is substantial but not excessive: €529 billion per year at €40, €1,373 billion at €80. Enough to build all the machines, lay all the infrastructure and give Africa a structural economy — while ensuring host countries receive their rightful share of the global climate operation.
| Market price | Margin/tonne | Profit at base 100 km | Profit at physical maximum |
|---|---|---|---|
| €40/tCO₂ | €25.09 | €529bn/year | €2,027bn/year |
| €60/tCO₂ | €45.09 | €951bn/year | €3,643bn/year |
| €80/tCO₂ | €65.09 | €1,373bn/year | €5,259bn/year |
How wide should each area be?
The optimal rollout follows the return on investment at each step. Every 100-kilometre expansion is ranked by profit per hectare — and the most profitable comes first. The answer is not “175 km everywhere”. It is: South America first to the full 400 kilometres, then northern Australia to 400 km, followed by the Sahara Coast-to-Coast to 500 km. Southern Europe receives only its physical 30 km — or none at all, if it is not needed.
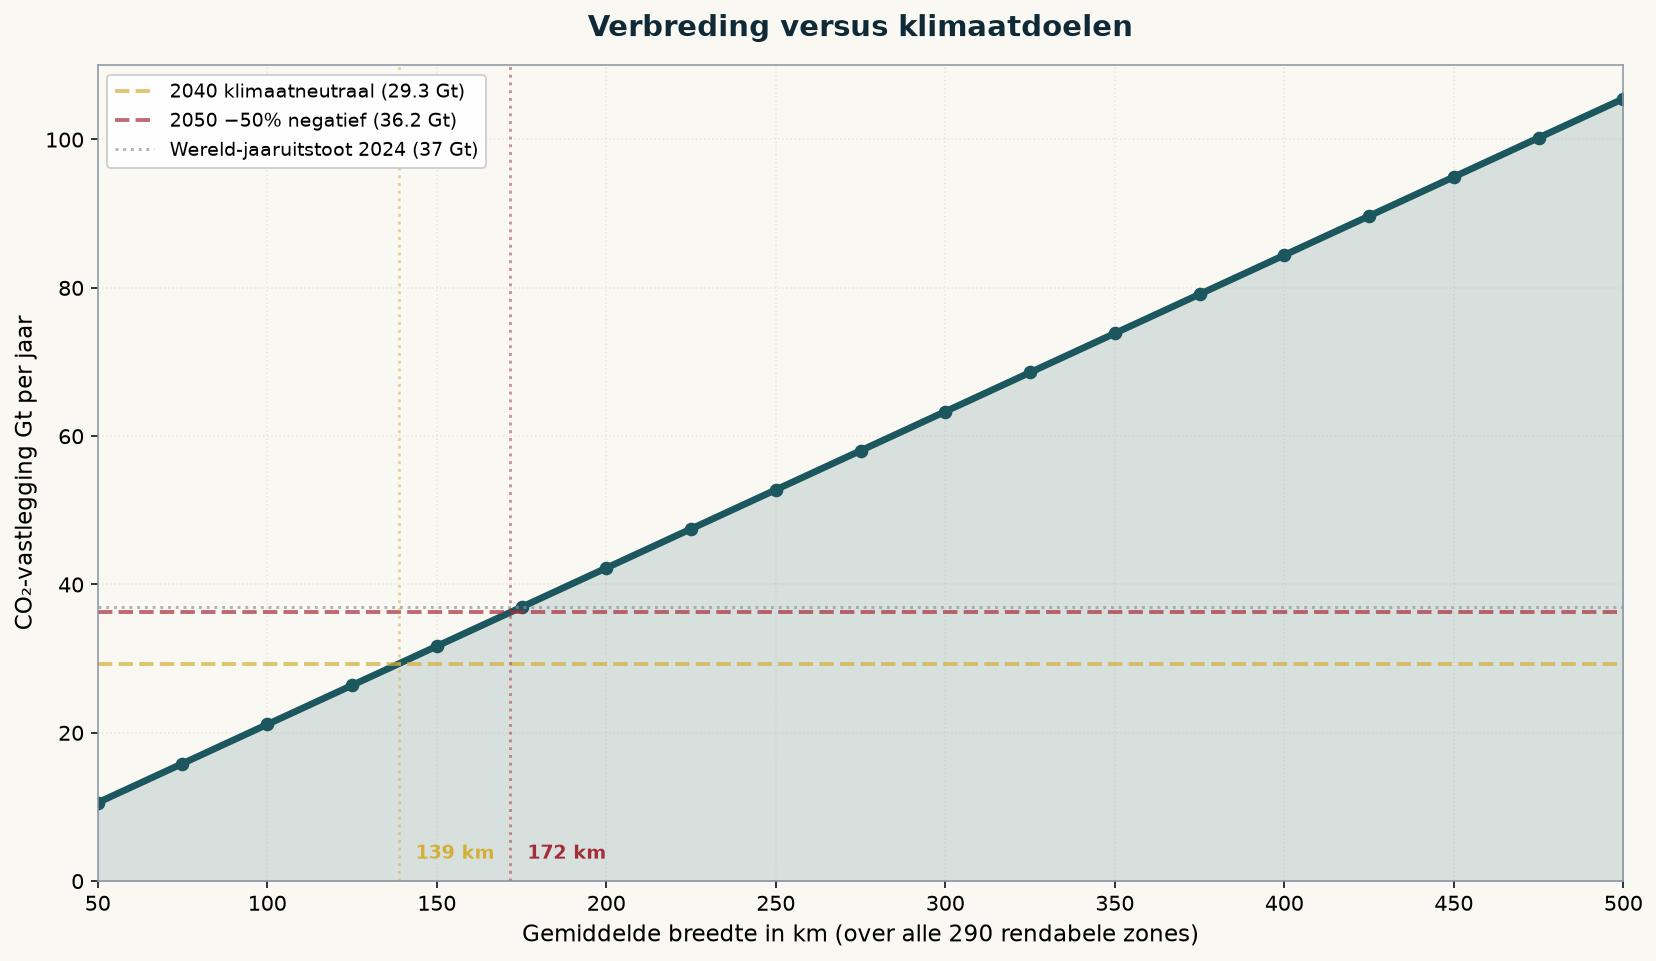
2040 rollout: South America Andes-Amazon at the full 400 km (29.1 Gt/year, €527 billion profit at €80); northern Australia at 100 km (2.2 Gt/year, €155 billion profit); the Sahara Coast-to-Coast in a 15-km pilot phase for infrastructure and Great Green Wall coordination. All other corridors: not yet active.
2050 rollout (−50% negative): South America at the full 400 km; northern Australia expanded to 400 km (8.9 Gt/year); the Sahara still held in reserve. All European corridors: still 0 km. Unnecessary for these targets.
840,000 new jobs in Europe — this is not an austerity story
What is striking about this climate plan is that it is neither an austerity story nor a demand for sacrifice from European citizens. It is an industrial expansion on a scale Europe has not seen since post-war reconstruction. The machines — 6 metres wide, 1,000 metres per hour, 300 litres of fuel per hour, with AI condition monitoring and satellite verification — will be built in Germany, the Netherlands, Italy and France. The electronics and AI modules will come from Swiss and Swedish suppliers. The components will be produced by tens of thousands of European SMEs.
Around 98,000 machines are needed worldwide at the physical maximum, with a replacement cycle of five years — meaning 20,000 machines per year in continuous production. Each machine costs approximately €875,000 in CAPEX plus €25,000 for AI modules. Around 40% of that goes on labour: design, assembly, electronics, testing and servicing. At an average European labour cost of €70,000 per FTE per year, that creates 840,000 new jobs.
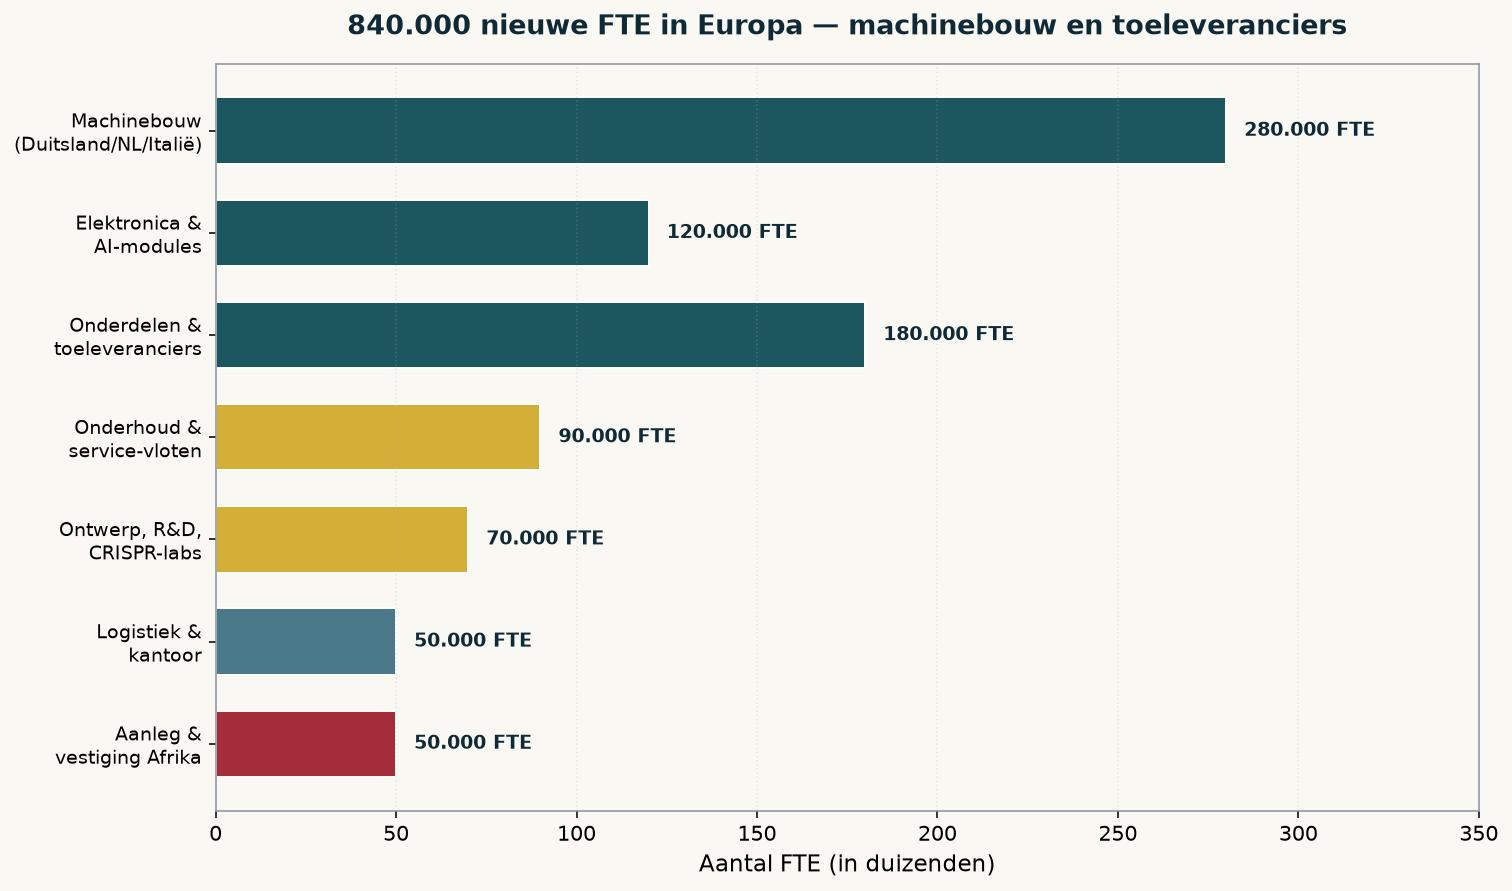
These 840,000 jobs are structural, not cyclical. They will exist for as long as the climate programme does — at least 30 years. They will be distributed across all EU member states with industrial capacity. And they require no retraining for people already working in the automotive industry, steel production or manufacturing.
Asylum seekers as partners — a vision of the future that our democracy cannot offer
The greatest political truth exposed by this climate plan is one that Europe would rather not articulate: our “democracy” offers hundreds of thousands of asylum seekers no prospect of a future. They arrive in tents and containers, wait years for procedures, are not allowed to work, and when they are eventually granted status, the first generation is shut out of the labour market and the second alienated from both cultures. This is not a failure of intentions — it is a structural failure of European society as it functions today.
The World Belt offers something fundamentally different. In Mauritania, Mali, Niger, Chad, Sudan, Ethiopia, Colombia, Peru and Bolivia, hundreds of thousands of jobs will emerge over the next 25 years — machine operators, technicians, satellite analysts, verifiers, coordinators, plant biologists and water managers. These jobs are new, skilled, ecologically meaningful and paid at world-market rates with a fair uplift above local wages. They are precisely what first-generation migrants seek and rarely find in Europe: meaningful work, in their own region, in their own language, with prospects for a career and a family.
Anyone with a good job in Mauritania’s climate programme has no need to go to Germany. Anyone learning a technical profession in Mali with a career path has no need to live in a Berlin container. Anyone working on the CO₂ programme in Colombia has no need to go to Madrid.
What one hundred thousand European social workers and interpreters cannot achieve, the climate programme achieves by itself. Not by “sending people back”, but by giving them a reason to want to return: a job, a career, a family, a home, a country with a future once again.
What remains — 135 red crosses on the map
The 135 zones that remain unprofitable even at €80 per tonne also deserve explicit mention. They are concentrated in the driest, most fragmented areas: the Egyptian interior, the Syrian and Iraqi highlands, the Yemeni mountains and the Rub al-Khali. Simply too dry physically. Too unstable politically. Too fragmented in landscape. They will be skipped. Full stop.
The Levant, the Southern European Mediterranean, Iberian Marginal Land and the Balkan Steppe fringe are also technically possible but economically marginal and of little climate-policy necessity. They are not needed to achieve neutrality by 2040 and a 50% reduction by 2050. They are merely an option should setbacks in the main corridors accumulate.
What this is, and what it is not
This is neither a utopia nor a technofix. It is a differentiated, quantified investment proposal for a concrete climate operation across 290 profitable zones. It is technically feasible with existing technology — Juncao and Moringa already grow in the target areas, the machines are a scaled-up version of existing agricultural technology, and satellite verification has existed for ten years. It is economically viable at a market price already achieved today in the EU ETS.
It is politically difficult because it breaks three taboos at once. It says that parts of Europe’s climate effort (the Southern European Mediterranean, Iberia and the Balkans) are pointless and should be skipped. It presents climate policy as a growth industry rather than an industry of loss. And it outlines a return perspective for migrants that explicitly recognises that our democracy structurally offers them no future.
This newspaper believes it is time to break those three taboos. The figures are there. The machines can be built. The countries are willing. What remains is the political courage to choose differentiation over consensus, industry over austerity, and honesty about migration over self-deception.