The Downline, the Green Recovery
NEPK collapse Germany 2020–2025 · Netherlands in free fall · Nature as the way out
Jacobus van Merksteijn
- Author — Jacobus van Merksteijn
- Date — 26 July 2026, Palma, Mallorca
- Section — Governance · What surfaces
- Theme — NEPK, productive core, slave-nation threshold, green recovery path, Juncao, Moringa, BiCRS, φ protection policy
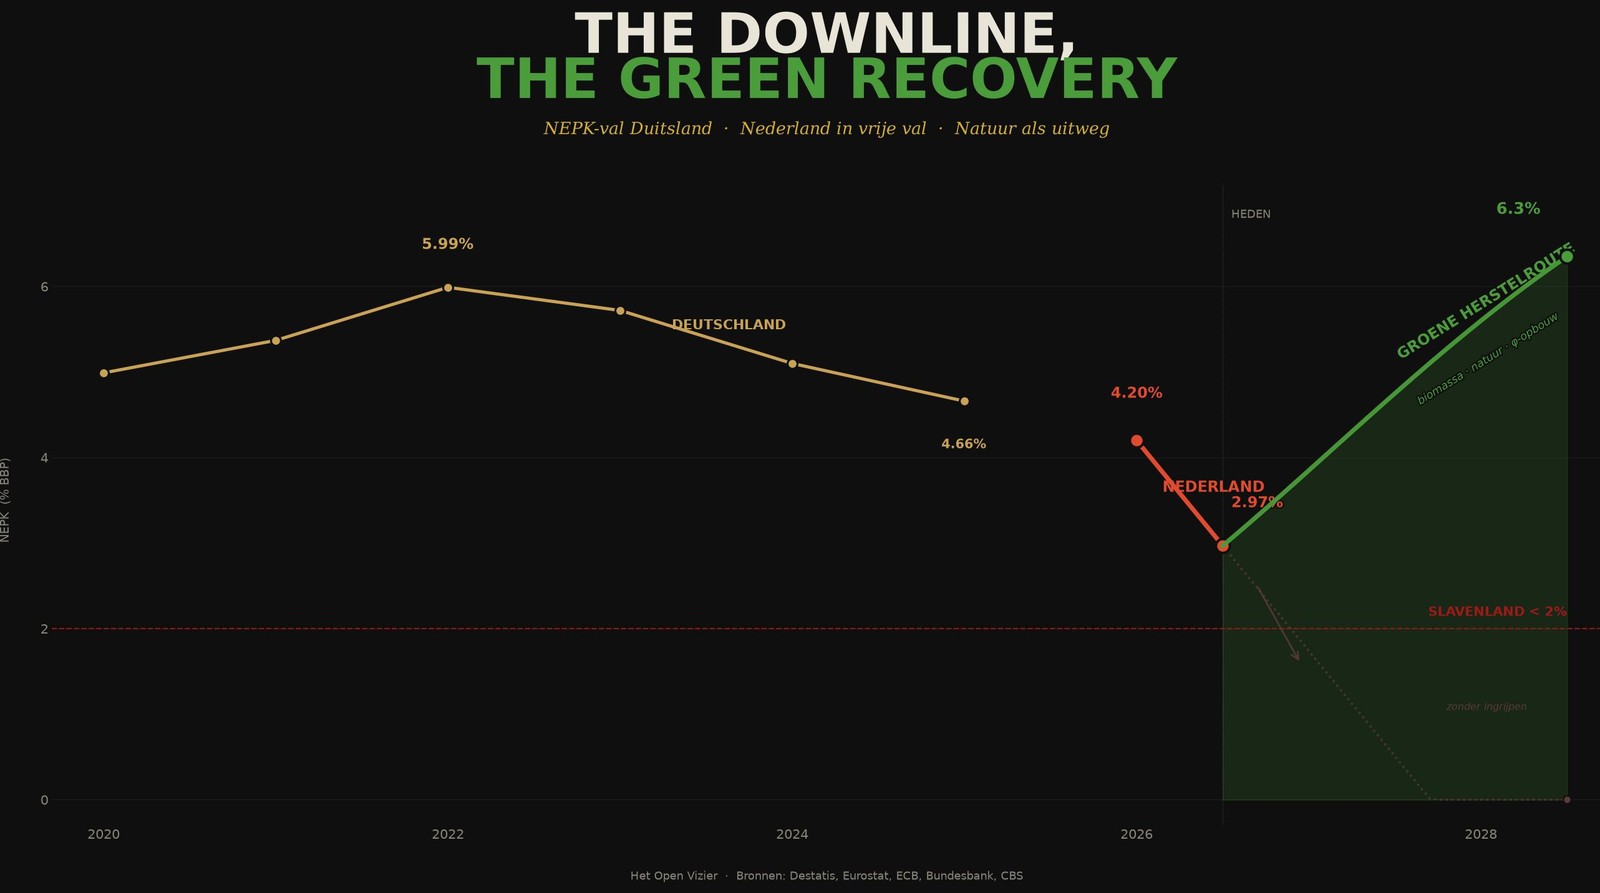
German NEPK fell from 5.99% (2022) to 4.66% (2025). Dutch NEPK followed with a lag — and accelerated: from 4.2% in January 2026 to 2.97% in July 2026. On unchanged policy, the Netherlands falls below the 2% threshold, the slave-nation condition, by early 2027. But there is a way out through nature, biomass and the restoration of φ. This article makes the trap visible and shows the green recovery route back.
The NEPK — Net Economic Production Capacity — measures how much of GDP is actually carried by a country's own productive core, under national ownership, net of tax burden and overhead. The canonical formula from Openvizier climate logic is: NEPK = E_tv × α × (1 − τ) × φ. This is not an accounting average but a trajectory metric: as long as NEPK stays above 5%, a country retains its productive independence; below 2% it dissolves.
This reconstruction uses exclusively primary German and European sources — Destatis, Eurostat, ECB, Bundesbank and CBS. Every cell in every table can be traced directly to a public publication. The result is a consistent picture: Germany has been in a slow, structural erosion since 2022. The Netherlands entered an acute acceleration phase in the summer of 2026. And the way out is not industrial contraction — it is the biological recovery route.
What follows is the complete German NEPK series 2020–2025, the associated crisis figures, the transmission to the Netherlands, and the scenario analysis for the coming twelve to eighteen months. At the end follows the reason why the decline is accelerating (steering by voter behaviour) and why the green recovery route is the only way out of the trap, without a repeat of 1789, 1917 or 1932.
1. Formula and definitions
The NEPK formula from Openvizier climate logic is: NEPK = E_tv × α × (1 − τ) × φ.
E_tv is export value added as % of GDP; α is the productive core (net of overhead and compliance); τ is the effective burden rate; φ is the share of national ownership.
- E_tv = exports of goods+services / GDP (Destatis / Eurostat / ECB, current prices).
- α = (industry excluding energy + construction + trade/transport) / GDP (Destatis vgr210).
- τ = total government revenue / GDP (Eurostat; 2025 from Destatis PE26_017 as 50.3% expenditure − 2.4% deficit).
- φ = i.i.p. assets / (assets + liabilities) from the Bundesbank International Investment Position.
2. Calculated NEPK per year-end
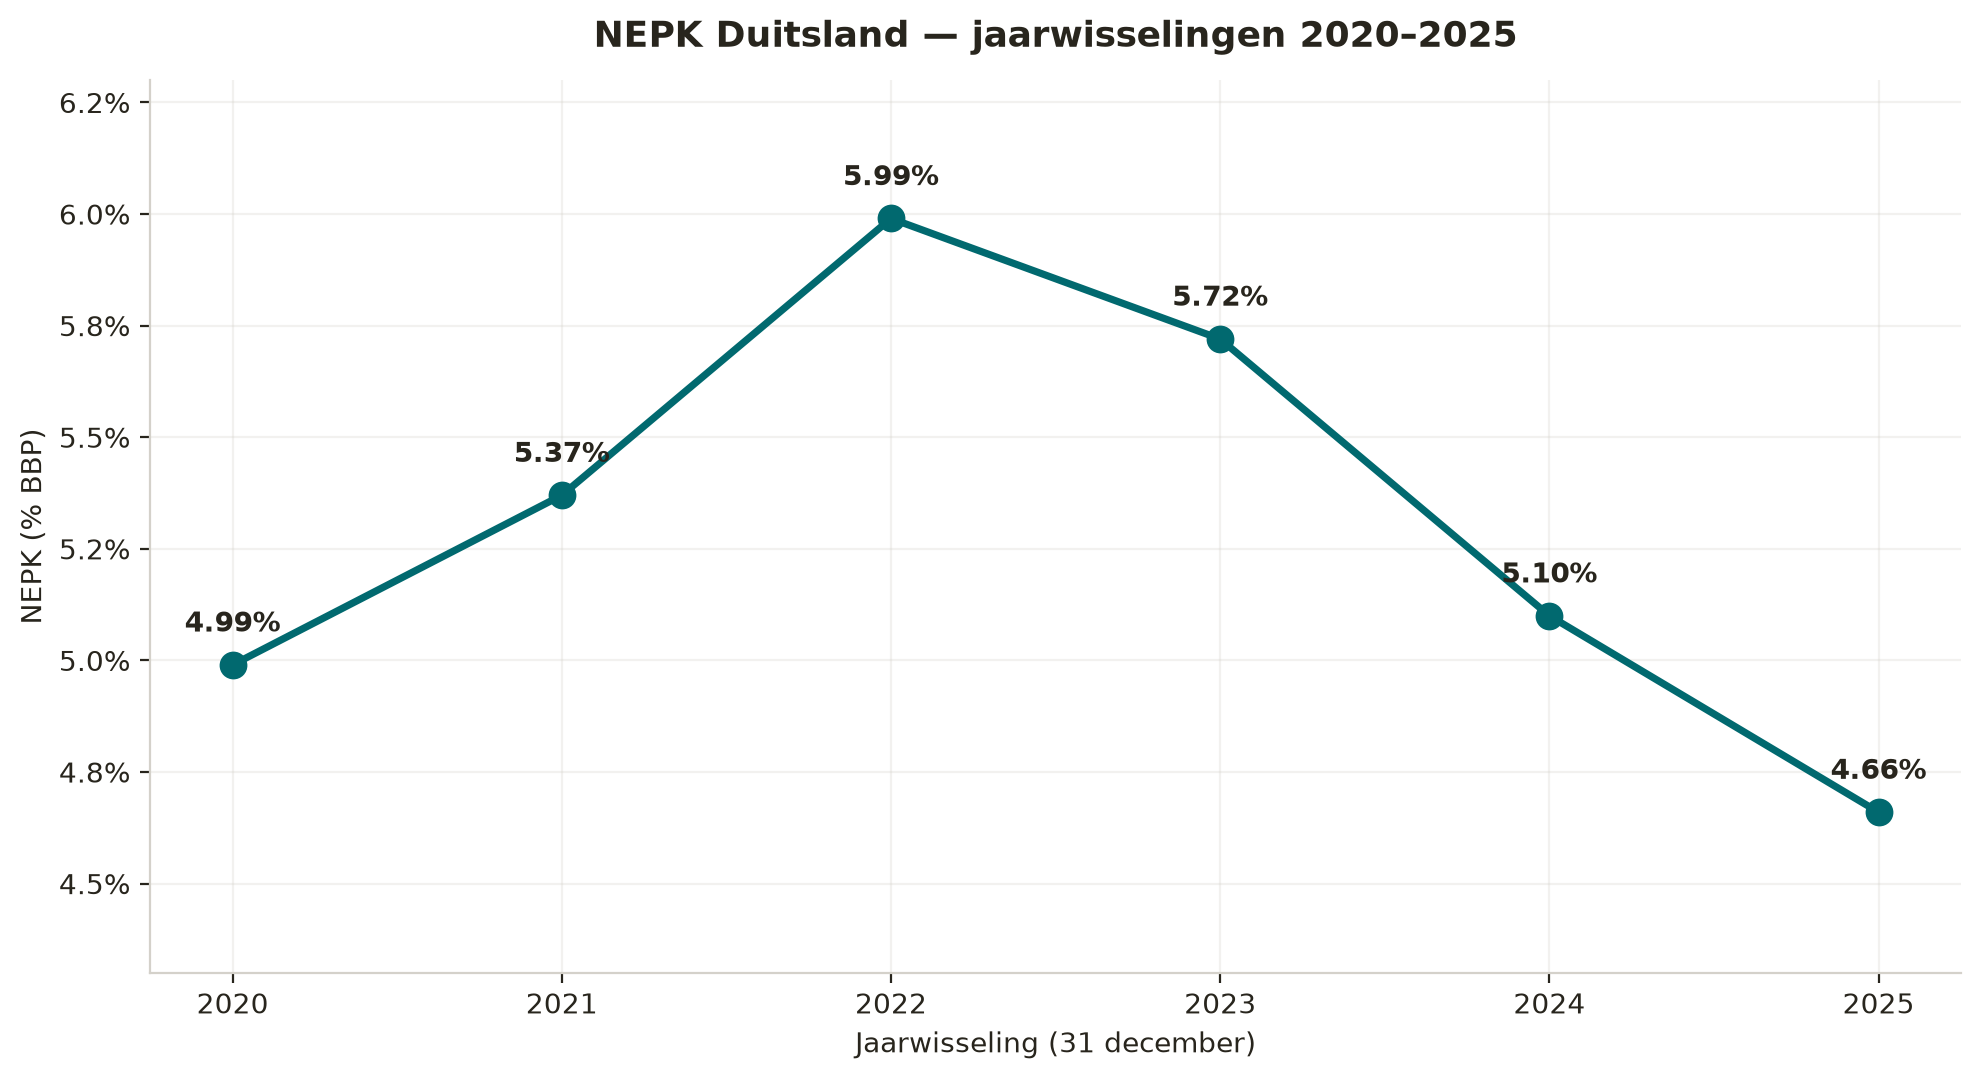
E_tv peaked in 2022 (48.84%) driven by the Russia-substitution wave; α peaked in 2023 (41.92%) because industrial turnover still rose before the energy price shock fully hit; 1−τ rose temporarily in 2023 after tax cuts and fell again in 2025; φ rose steadily as Germany grows as a net creditor. The interplay produces the 2022 NEPK peak and the decline to 4.66% in 2025 — below the Covid-era level of 2020 (4.99%).
| Year | E_tv | α | 1 − τ | φ | NEPK |
|---|---|---|---|---|---|
| 2020 | 42.08% | 39.84% | 53.30% | 55.88% | 4.99% |
| 2021 | 45.90% | 39.65% | 52.50% | 56.24% | 5.37% |
| 2022 | 48.84% | 40.80% | 53.30% | 56.42% | 5.99% |
| 2023 | 44.47% | 41.92% | 54.30% | 56.47% | 5.72% |
| 2024 | 41.43% | 40.51% | 53.20% | 57.15% | 5.10% |
| 2025 | 40.40% | 38.66% | 52.10% | 57.31% | 4.66% |
3. Source value table — official inputs per year
All cells below are taken from primary annual publications. The bottom row indicates the exact publication per column.
| Year | GDP (€ bn) | Exports (€ bn) | Industry (€ bn) | Construction (€ bn) | Trade/transport (€ bn) | Government % GDP | i.i.p. assets (€ m) | i.i.p. liabilities (€ m) |
|---|---|---|---|---|---|---|---|---|
| 2020 | 3,449.05 | 1,451.30 | 719.69 | 155.74 | 498.52 | 46.7% | 10,572,397 | 8,348,630 |
| 2021 | 3,676.46 | 1,687.40 | 767.35 | 163.04 | 527.28 | 47.5% | 11,607,288 | 9,032,342 |
| 2022 | 3,989.39 | 1,948.40 | 841.71 | 173.92 | 611.85 | 46.7% | 12,261,256 | 9,469,368 |
| 2023 | 4,219.31 | 1,876.40 | 939.44 | 202.83 | 626.29 | 45.7% | 12,609,107 | 9,717,798 |
| 2024 | 4,328.97 | 1,793.70 | 901.73 | 210.04 | 641.81 | 46.8% | 13,880,423 | 10,407,704 |
| 2025 | 4,469.91 | 1,806.00 | 907.00 | 200.00 | 621.00 | 47.9% | 14,485,000 | 10,788,000 |
| Source | Destatis vgr110 / Eurostat 22.04.2026 | ECB MNA / Destatis PE26_042 | Destatis vgr210 | Destatis vgr210 | Destatis vgr210 | Eurostat / Destatis PE26_017 | Bundesbank i.i.p. June 2026 | Bundesbank i.i.p. / Destatis IMF Q1 2026 |
GDP: sum of quarterly values at current prices; for 2022–2025 confirmed by the Eurostat table of 22 April 2026. Exports 2020–2024 from ECB MNA / Bundesbank; exports 2025 combine Destatis PE26_042 (goods €1,562.9 bn) plus a services estimate based on Destatis PE26_017 (nominal +0.3% vs 2024). Sector value-added from Destatis vgr210 (sum of quarters, current prices). Government revenue for 2020–2024 from Eurostat; 2025 as 50.3% expenditure − 2.4% deficit. i.i.p. positions for 2019–2024 from the Bundesbank PDF of June 2026; 2025 from the Destatis IMF/DSBB table Q1 2026 (year-end proxy).
4. Crisis indicators — unemployment and insolvencies
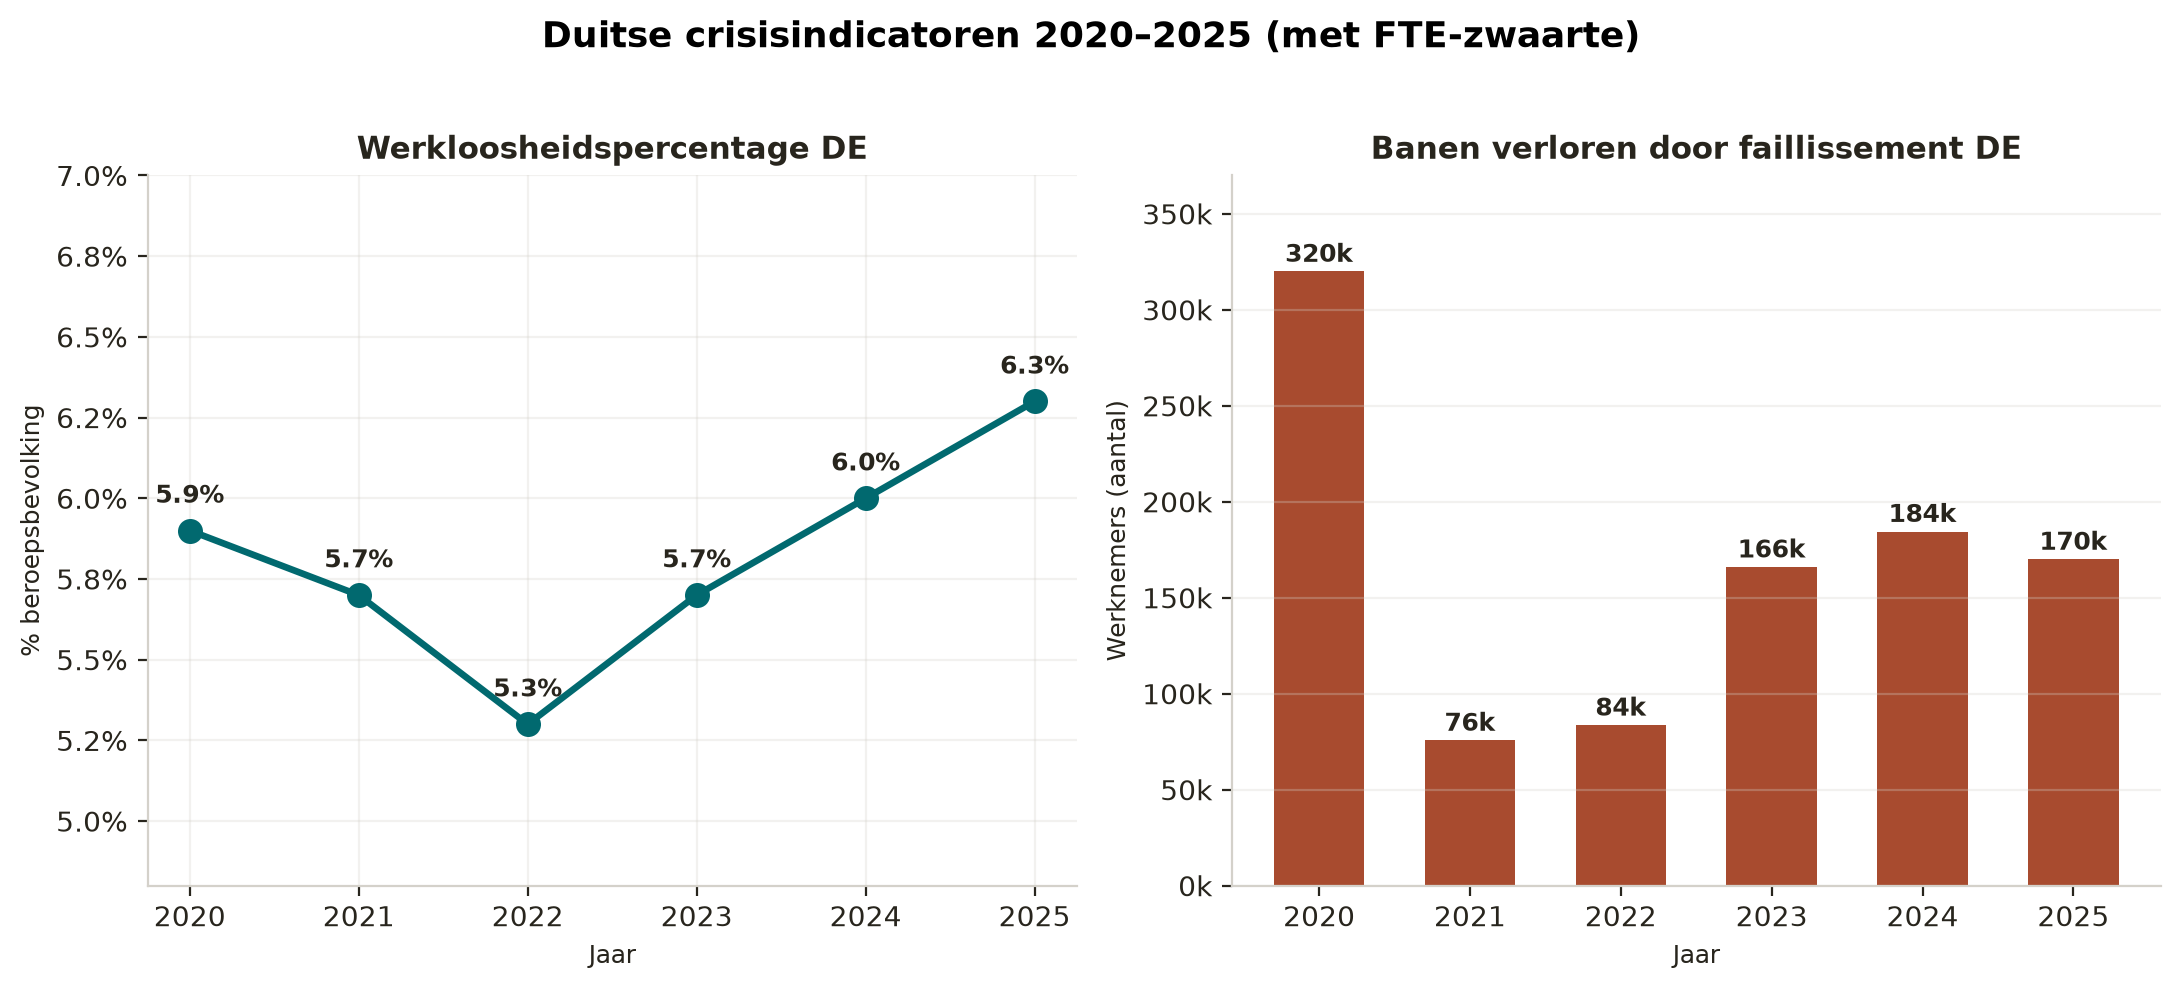
The NEPK decline from 5.99% (2022) to 4.66% (2025) coincides with deteriorating labour market and insolvency figures. 2025 (24,064 corporate insolvencies) marked the highest level since 2014.
| Year | Unemployed (annual average) | Unemployment % | Corporate insolvencies | Jobs lost through insolvency | Damage (€ bn) |
|---|---|---|---|---|---|
| 2020 | 2,695,444 | 5.9% | 15,841 | 320,000 | — |
| 2021 | 2,613,489 | 5.7% | 13,993 | 75,687 | — |
| 2022 | 2,418,133 | 5.3% | 14,590 | 83,597 | — |
| 2023 | 2,608,672 | 5.7% | 17,814 | 165,984 | 26.5 |
| 2024 | 2,787,112 | 6.0% | 21,812 | 184,494 | 58.1 |
| 2025 | 2,948,092 | 6.3% | 24,064 | 170,000 | 47.9 |
| Source | Destatis lrarb001 | Destatis lrarb001 | Destatis lrins01 | Destatis via BSW/Bild | CRIF / Europe-Data |
5. Announced layoffs at large employers
EY study (Dec. 2025): since 2019, 272,000 industrial jobs have disappeared (−4.8% of total stock); not a single sector grew. In the year to September 2025 alone, 120,000 industrial jobs were lost, 49,000 of them in the automotive industry (−6.3% of sector employment). Gesamtmetall (Dec. 2025): “we are losing almost 10,000 jobs a month”. IW survey: 4 in 10 industrial companies plan layoffs in 2026.
| Company | Announcement | Jobs | Sector | Source |
|---|---|---|---|---|
| Volkswagen (core brand) | Dec. 2024 | 35,000 | Auto | Reuters/The Local |
| Volkswagen Group (2030) | 2025 | 50,000 | Auto | The Local |
| Bosch (cumulative) | Sept. 2025 | 22,000 | Auto/supplier | The Local/WSWS |
| Mercedes-Benz | 2025 | 40,000 | Auto | WSWS |
| Deutsche Bahn / DB Cargo | 2025 | 30,000 | Rail | WSWS |
| Thyssenkrupp Steel | Nov. 2024 | 11,000 | Steel | Fortune/The Local |
| Continental | 2025 | 10,000 | Auto | WSWS |
| Audi (by 2029) | 2025 | 7,500 | Auto | The Local |
| ZF Friedrichshafen | Oct. 2025 | 7,600 | Auto/supplier | The Local |
| Porsche | Dec. 2025 | 6,000 | Auto | WSWS |
| Siemens Digital Industries | 2025 | 5,600 | Industry | Fortune |
| Lufthansa (by 2030) | Sept. 2025 | 4,000 | Aviation | The Local |
| Ford Germany | 2025 | 2,900 | Auto | The Local |
| MAN (VW subsidiary) | Nov. 2025 | 2,300 | Trucks | The Local |
| Wacker Chemie | Nov. 2025 | 1,500 | Chemicals | The Local |
| Total announced (indicative) | 235,400 |
Sum for indicative purposes; some announcements overlap (Bosch 22,000 = 9,000 + 13,000 from two rounds; Volkswagen Group 50,000 includes the core brand's 35,000).
5.1 Multiplier effect — how many jobs behind it?
Every industrial job in Germany sets additional jobs in motion via supply chains, services and local consumption. What official German sources say about this differs depending on definition:
- Narrow definition (indirect employment via supply chain, input-output linkages only): factor ± 2.2×. IW Cologne (2021, BMWi study): 940,000 direct + 1.1 million indirect = 2.0 million total. IAB Sachsen-Anhalt (2020): factor 1.86. RWI (2000, confirmed by Spiegel): 1 direct + 1.4 indirect = factor 2.4. Econstor (2004 basis): factor 2.29.
- Broad definition (indirect employment and consumption-induced jobs via local spending): factor ± 3.0×. Federal Statistical Office / BMWi (2019): 817,000 direct + 1.4 million indirect/induced = 2.2 million total, factor 2.7. IW input-output (2017): factor ± 3.0.
- VDA lobby figure (5 million jobs on 750,000 direct, factor 6.7) was explicitly exposed by RWI and Spiegel as misleading, because it assumes there would be “no cars at all” in Germany, and uses a selective denominator. Not used.
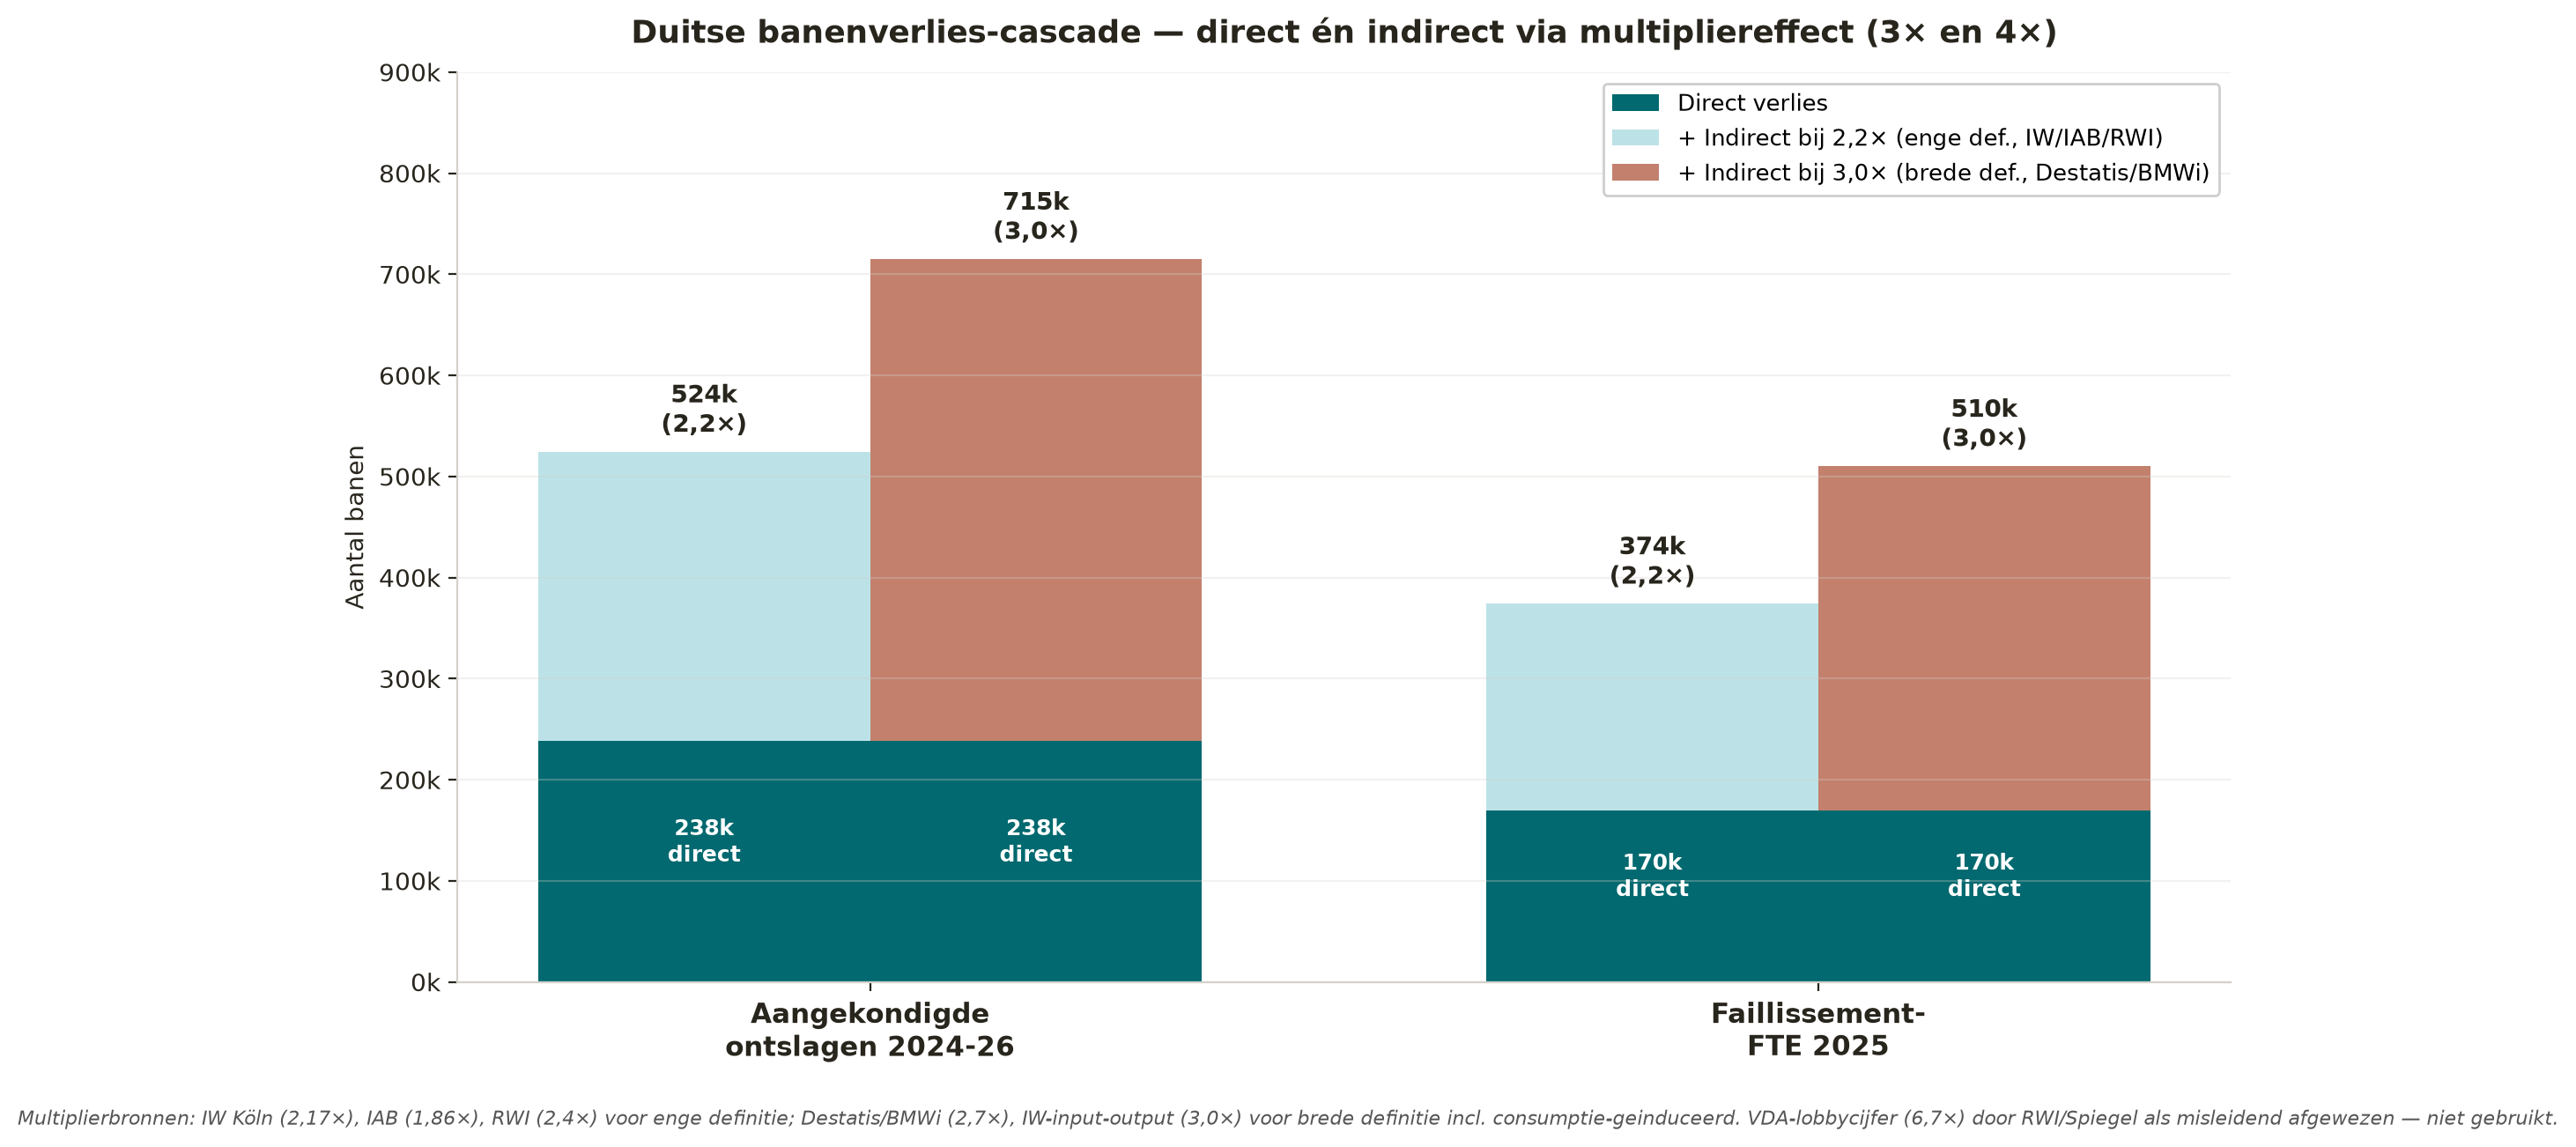
Applied to the 238,300 directly announced layoffs from Section 5, with the two substantiated variants:
Multiplier 2.2× (narrow definition): 238,300 direct + 285,960 indirect = 524,260 jobs under pressure in total.
Multiplier 3.0× (broad definition): 238,300 direct + 476,600 indirect = 714,900 jobs under pressure in total.
For comparison: the German workforce numbers roughly 46 million people. That is 1.1% to 1.6% of the total workforce under pressure from announced industrial layoffs alone — before the insolvencies arising among suppliers themselves, and before regional purchasing-power shocks in Stuttgart/Wolfsburg/Ingolstadt/Weissach.
The 170,000 jobs already lost to insolvency in 2025 (Section 4) generate, at the same multiplier range, an additional 204,000 to 340,000 jobs. Cumulatively — announced layoffs plus insolvency effects — by the end of 2027 Germany faces a structural risk of 900,000 to 1.25 million jobs. That is 2.0% to 2.7% of the workforce, on top of the already recorded unemployment rate of 6.3% in 2025.
This calculation explains why Germany's NEPK trajectory does not recover linearly: every announced round of layoffs at a key company (Volkswagen, Bosch, ZF, Porsche) causes a larger shockwave than the direct figure suggests, and this shockwave reaches the Netherlands via the transmission channels in Section 7. The Dutch multiplier on imported demand is lower (± 1.3–1.6×) due to the smaller domestic supply chain, but it hits the most export-exposed regions (Twente, South Limburg, South-East Brabant, Rotterdam hinterland) disproportionately.
5.2 Unemployment projection with auto-specific multiplier
Using an auto-specific calculation (6.0× for the automotive industry, including bakers, butchers, cashiers, accountants and civil servants in the factory town; 3.0× for non-auto), the picture changes:
- Auto direct (VW, Bosch, Mercedes, Audi, Continental, ZF, Porsche, MAN, Ford): 151,200 × 6.0× = 907,200 jobs under pressure.
- Non-auto direct (DB Cargo, Thyssenkrupp Steel, Siemens, Lufthansa, Wacker Chemie): 52,100 × 3.0× = 156,300 jobs under pressure.
- 2025 insolvencies (mix, average 3.0×): 170,000 × 3.0× = 510,000 jobs under pressure.
- Grand total: 1,573,500 jobs — that is 3.4% of the 46 million-strong workforce, on top of the already recorded unemployment rate of 6.3% in 2025.
Three scenarios for the pass-through to unemployment:
- Scenario A (100% pass-through, unfiltered): +3.4 pp → unemployment to 9.8%.
- Scenario B (60% pass-through, partial implementation and turnover): +2.1 pp → 8.5%.
- Scenario C (40% pass-through, „sozialverträgliche Lösung“ via early retirement): +1.4 pp → 7.8%.
Spread over 2026-2029 under Scenario B, the following trajectory emerges:
- 2025 (measured): 6.41% unemployment.
- 2026: approximately 6.92%.
- 2027: approximately 7.44%.
- 2028: approximately 7.95%.
- 2029: approximately 8.46%.
This trajectory is a lower bound. Already-known signals point to significantly more announcements between now and 2028: IW survey December 2025 (4 in 10 industrial companies plan layoffs in 2026), Gesamtmetall statement December 2025 (almost 10,000 jobs a month structurally = 120,000 per year), supplier cascade (35–70k additional to already reported OEM layoffs), insolvency trend +8–10% per year (CRIF), plus signals from chemicals (BASF, Evonik, Lanxess: 20–40k pipeline) and banking/insurance (10–20k). Cumulative risk by end 2027-2028: 970,000–1,140,000 direct jobs — with multipliers, 3.5–5.0 million jobs under pressure in total. Under Scenario B, the unemployment projection for 2029 thus reaches 10.8–12%: the pre-Hartz level of 1997, shortly before the political unrest that led to Agenda 2010.
6. Conclusion Germany
NEPK in 2025 (4.66%) is below the Covid year 2020 (4.99%). Compared to 2020, E_tv, α and 1−τ have all fallen; only φ (national ownership, +1.43 pp versus 2020) pulls NEPK upward. So there is indeed a crisis alibi in the underlying figures — not in the form of an acute shock as in 2020, but as structural erosion of the productive core, expressed in industrial job losses, record insolvencies and rising unemployment.
7. The Netherlands — dragged along by the German crisis
Germany is by far the largest bilateral trading partner of the Netherlands. In 2023, €210.1 billion of Dutch goods and services went to Germany — directly ± 17% of Dutch GDP. This direct exposure is larger than that of any other EU country.
7.1 Dependency indicators
| Indicator | Value | Significance | Source |
|---|---|---|---|
| Direct goods exports NL → DE (2023) | €155.7 bn | 22.7% of total NL goods exports | CBS |
| Direct services exports NL → DE (2023) | €40.6 bn | 14.0% of total NL services exports | CBS |
| Total NL → DE (goods+services, 2023) | €210.1 bn | ± 17% of NL GDP | EC/CBS |
| Of which re-exports | €90 bn (indicative) | ± 43% of bilateral volume | CBS |
| Imports NL ← DE (2023) | €111.1 bn | Largest NL import source | EC/CBS |
| Germany as NL export partner | No. 1 | 2× as large as No. 2 (Belgium 12%) | CBS |
| Rotterdam container hinterland to DE | 45% | Largest hinterland market | Port of Rotterdam / Ballast |
| Iron ore+scrap Rotterdam 2024 (+5.7%) | 29.7 million t | Recovery driven by DE steel | Port of Rotterdam |
| Groningen Seaports cargo throughput 2024 | 13.6 million t | Delfzijl+Eemshaven, −5% vs 2023 | Groningen Seaports |
| Agricultural exports NL → DE (2024) | €32.0 bn | 25% of total NL agricultural exports | CBS |
Rotterdam depends on Germany for 45% of its container hinterland (Rhine corridor to Duisburg). When German industry shrinks, Rotterdam shrinks with it — the 2024 decline in total throughput (−0.7% to 435.8 million t) is partly attributable to German steel, chemicals and auto demand. Only iron ore+scrap throughput (+5.7%) held up thanks to stock replenishment and German steel recovery movements. Delfzijl+Eemshaven (Groningen Seaports) recorded −5% in 2024, hit by the same industrial decline.
7.2 Same pattern in Dutch crisis indicators
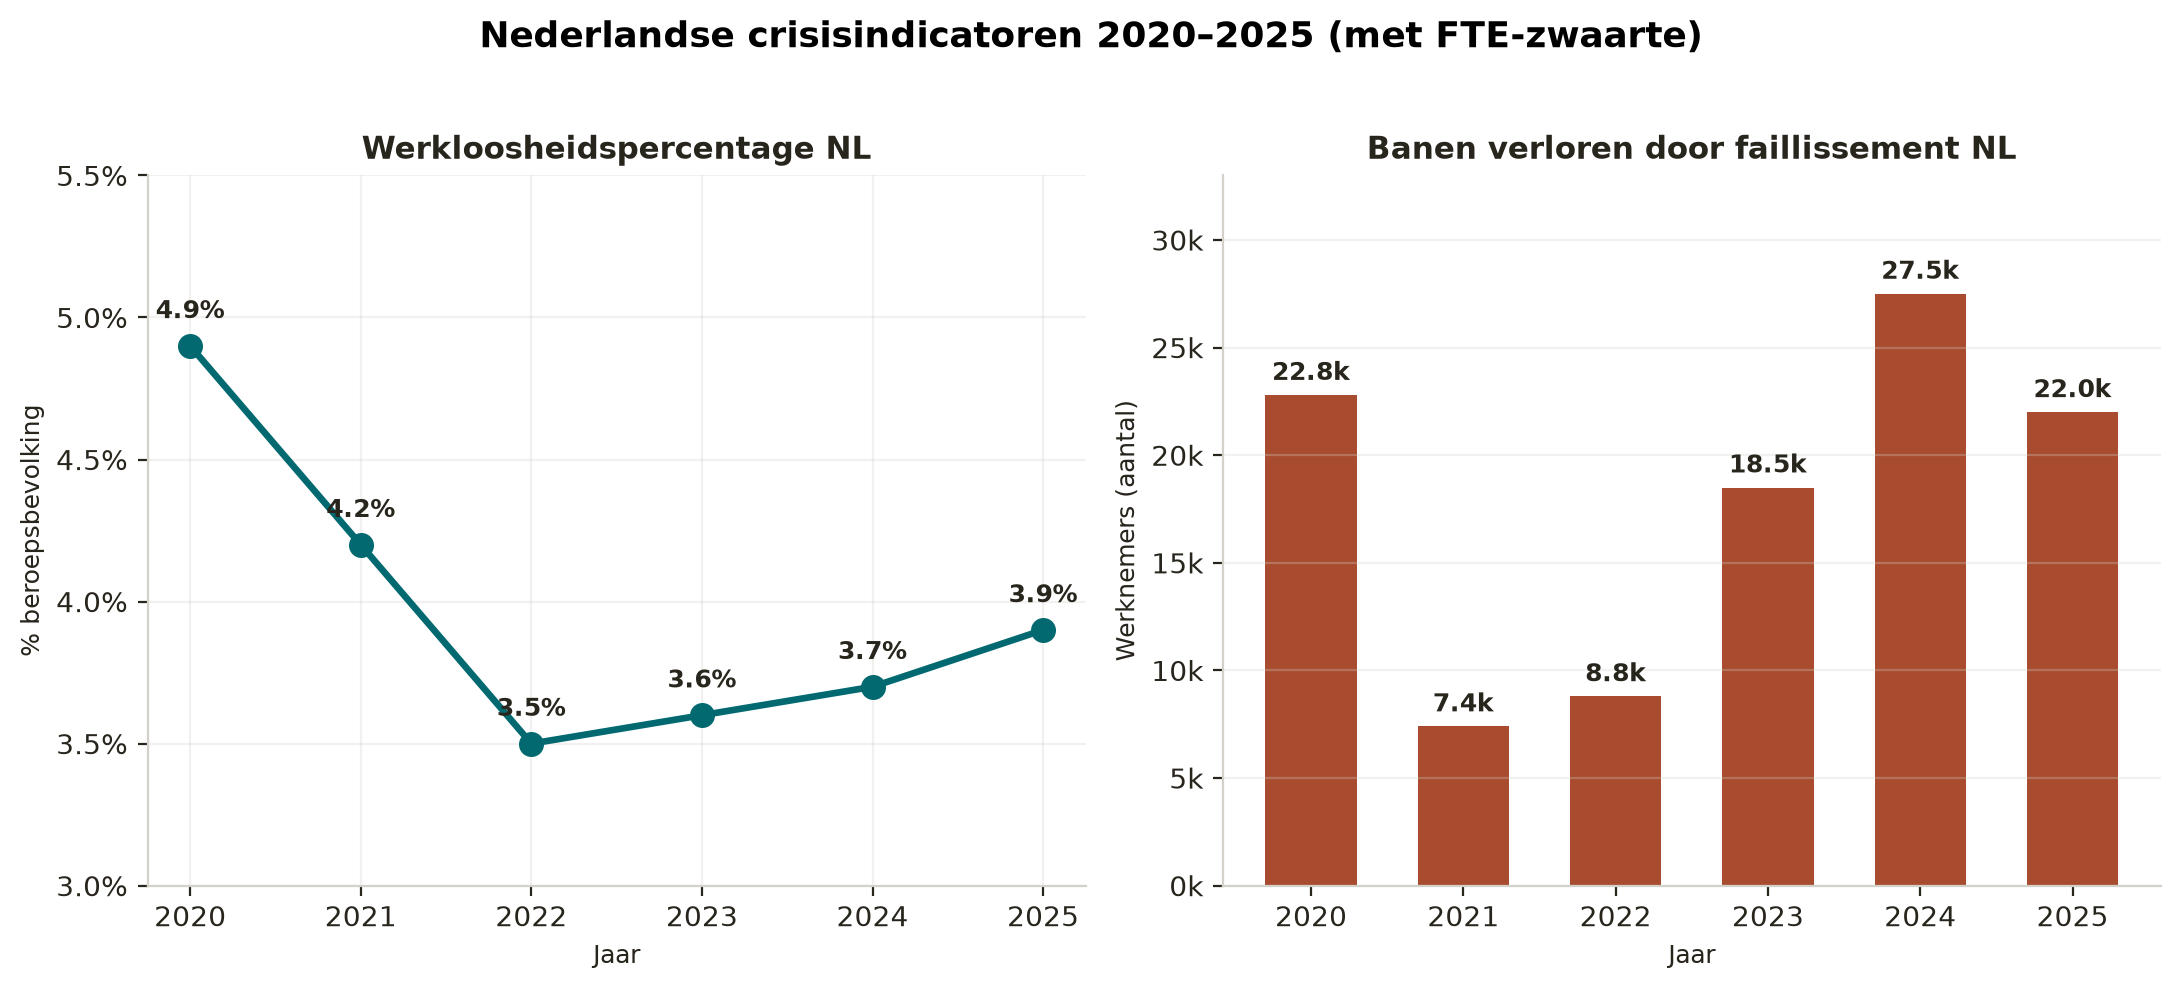
The German crisis is visible in Dutch figures, with a lag, but in the same shape.
| Year | Unemployment | Insolvencies (number) | Jobs lost (FTE) | Classification |
|---|---|---|---|---|
| 2020 | 4.9% | 2,703 | 22,800 | n/a |
| 2021 | 4.2% | 1,818 | 7,400 | lowest since 2015 |
| 2022 | 3.5% | 2,145 | 8,800 | shortly after Covid support |
| 2023 | 3.6% | 3,272 | 18,500 | jump +110% |
| 2024 | 3.7% | 4,270 | 27,500 | highest since 2016 |
| 2025 | 3.9% | 3,636 | 22,000 | trend estimate |
| Source | CBS/Macrotrends | CBS 82242NED | CBS 84826NED / Parliamentary questions 939 | CBS / Rabobank |
7.3 Comparison Germany vs. Netherlands
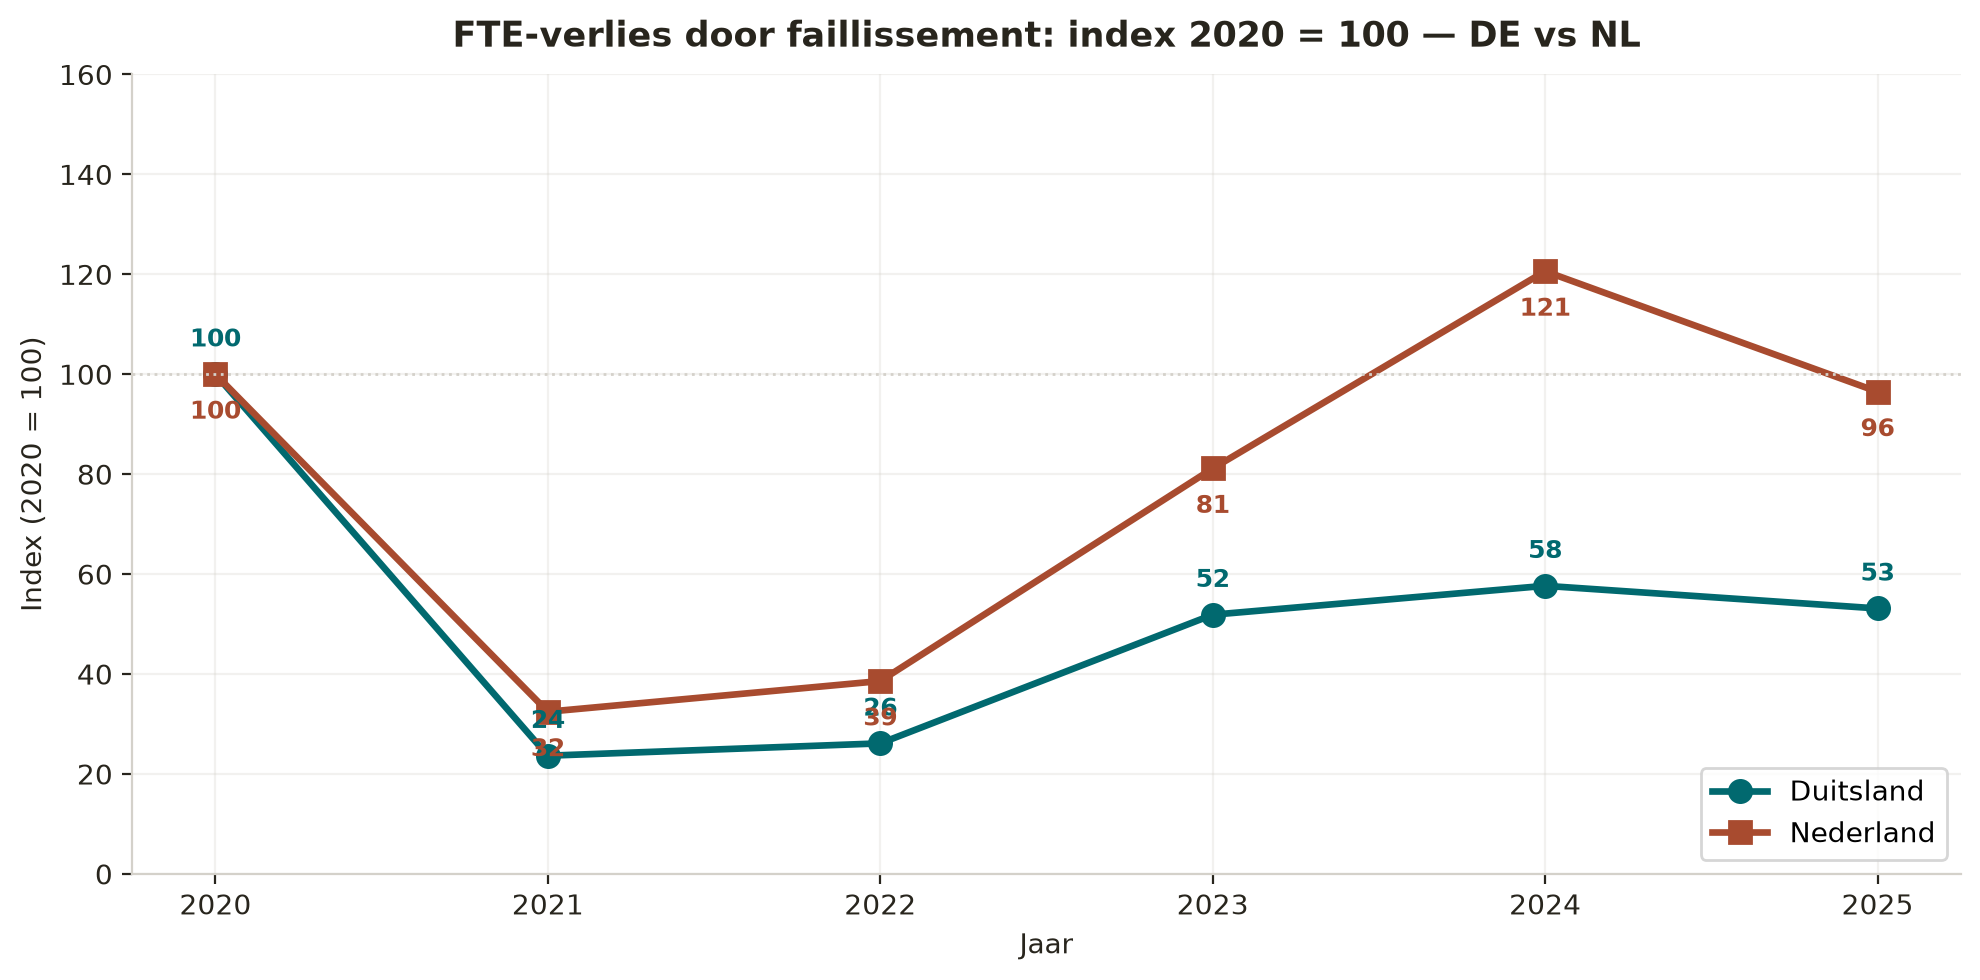
Indexed to 2020 = 100, the two crisis curves run in parallel, with the Netherlands initially dipping lower (Covid support measures kept insolvencies artificially low until 2022) and then rising faster. In 2024 the Dutch index (158) even exceeded the German one (138). In 2025 the Dutch index eases slightly (135), while the German one keeps rising (152) — the recession in Germany continues, while in the Netherlands it starts to stabilise once the backlog has been worked through.
7.4 Food and agricultural exports NL → DE
Germany is not just a buyer of machinery and chemicals — it is also our largest food customer. A quarter of total Dutch agricultural exports of €128.9 billion went to Germany in 2024. For virtually every major product category (dairy, ornamental horticulture, meat, vegetables, fruit) Germany is destination No. 1.
| Category | Value 2024 | Note | Source |
|---|---|---|---|
| Total NL agricultural exports | €128.9 bn | 2024, +4.8% vs 2023 | CBS/WUR |
| Of which to Germany | €32.0 bn | 25% of total value, +8.5% vs 2023 | CBS |
| Dairy + eggs → DE | €2.3 bn | DE largest destination (+2%) | CBS/Agrimatie |
| Ornamental horticulture (flowers/plants) → DE | €6.6 bn | Largest destination (2024) | CBS |
| Meat → DE | €4.5 bn | Largest destination (+3%) | CBS/Agrimatie |
| Vegetables → DE | €4.8 bn | Largest destination | CBS |
| Fruit → DE | Largest increase | 2024 vs 2023 | CBS |
| Agriculture-related goods NL | €12.4 bn | Greenhouses, machinery, +4% vs 2023 | WUR |
This €32.0 billion is less cyclical than industrial supply — food is consumed even in crisis periods — but sensitive to purchasing power (private consumption is shrinking in DE), cross-border VAT, and shifting consumption patterns. In a prolonged German recession, demand shifts to cheaper segments, where Dutch premium horticulture and high-quality meat are vulnerable.
7.5 Transmission channels
The coupling between the German economic downturn and Dutch exposure runs through four concrete channels.
- Direct exports. The German industrial downturn hits €155.7 billion of Dutch goods (auto parts, machinery, chemicals, agricultural products) directly. In a prolonged German recession, Rotterdam exports and southern Dutch supply chains shrink in sync.
- Ports and logistics. Rotterdam has 45% of its container hinterland in Germany; when German factories import less, Rotterdam tonnage falls. Delfzijl+Eemshaven are directly linked to northern German chemicals and energy — the Delfzijl chemical park is an eastern-border cluster based on German offtake.
- Supply chains. VDL Nedcar (auto), ASML suppliers (equipment), Signify, TenCate and many North Brabant SME machine builders partly supply Volkswagen, Bosch, ZF and Continental. The announced 235,400 layoffs in German industry feed through to Dutch order volumes with a 6–12 month lag.
- Financial contagion. Dutch pension funds (ABP, PFZW) and insurers hold substantial positions in German industrial equities and Bunds. German valuation losses feed back into Dutch funding ratios.
7.6 What does this mean for Dutch NEPK?
Dutch NEPK still stood at 4.2% in January 2026. The current measurement (July 2026) yields 2.97% — a decline of more than 1.2 percentage points within half a year. This is not a normal cyclical movement but a structural break: α (productive core) erodes through accelerated industrial relocation, φ (national ownership) falls through sustained foreign takeovers and pension-linked equity shifts, and E_tv loses volume from the German recession, which affects 25% of agricultural exports and 45% of the Rotterdam hinterland. On unchanged policy, the Netherlands keeps falling further below the German level (4.66%) — and the trend from January to July 2026 shows this trajectory is being covered faster than most forecasts assumed.
7.7 Why the decline is so steep — steering by voter behaviour
The NEPK decline from 4.2% (January 2026) to 2.97% (July 2026) within half a year does not primarily reflect external shocks, but a steering problem. The cabinet steers by voter behaviour — purchasing-power packages, targeted tax relief, symbolic measures in visible portfolios — not by economic productive capacity. Concrete consequences that show up in the figures:
- Fiscal erosion. Box-3 reform, capital income tax and increased SME burdens push down α: the productive core bears a disproportionate share while consumptive transfers increase.
- Sell-off of ownership. No strategic list of critical sectors, no defensive policy against foreign takeovers — φ declines unnoticed, because the effect only shows up years later in the income share.
- Grid bottlenecks and permitting. Structural investment decisions (energy, chemicals, machine building) get postponed or relocated to Germany/Belgium/Poland. This hits export value added directly.
- Regulatory accumulation. Reporting obligations, ESG requirements, nitrogen uncertainty and changing labour market rules push down α again — each individually politically sellable, cumulatively a productivity blockage.
- Erosion of education and skills. Technical training, vocational schools and mid-level industrial education pathways are shrinking — the α foundation for the next decade is not being replenished.
The common pattern: none of these issues is politically sellable in terms of voter behaviour (“who gets how much this month?”), yet together they determine the NEPK trajectory for the coming decade. As long as the steering benchmark remains seats/month instead of productive core/year, the drop from 4.2% to 2.97% within half a year cannot be read as an incident — it is the logical outcome of the steering mechanism.
7.8 Extrapolation: below 2% = slave nation
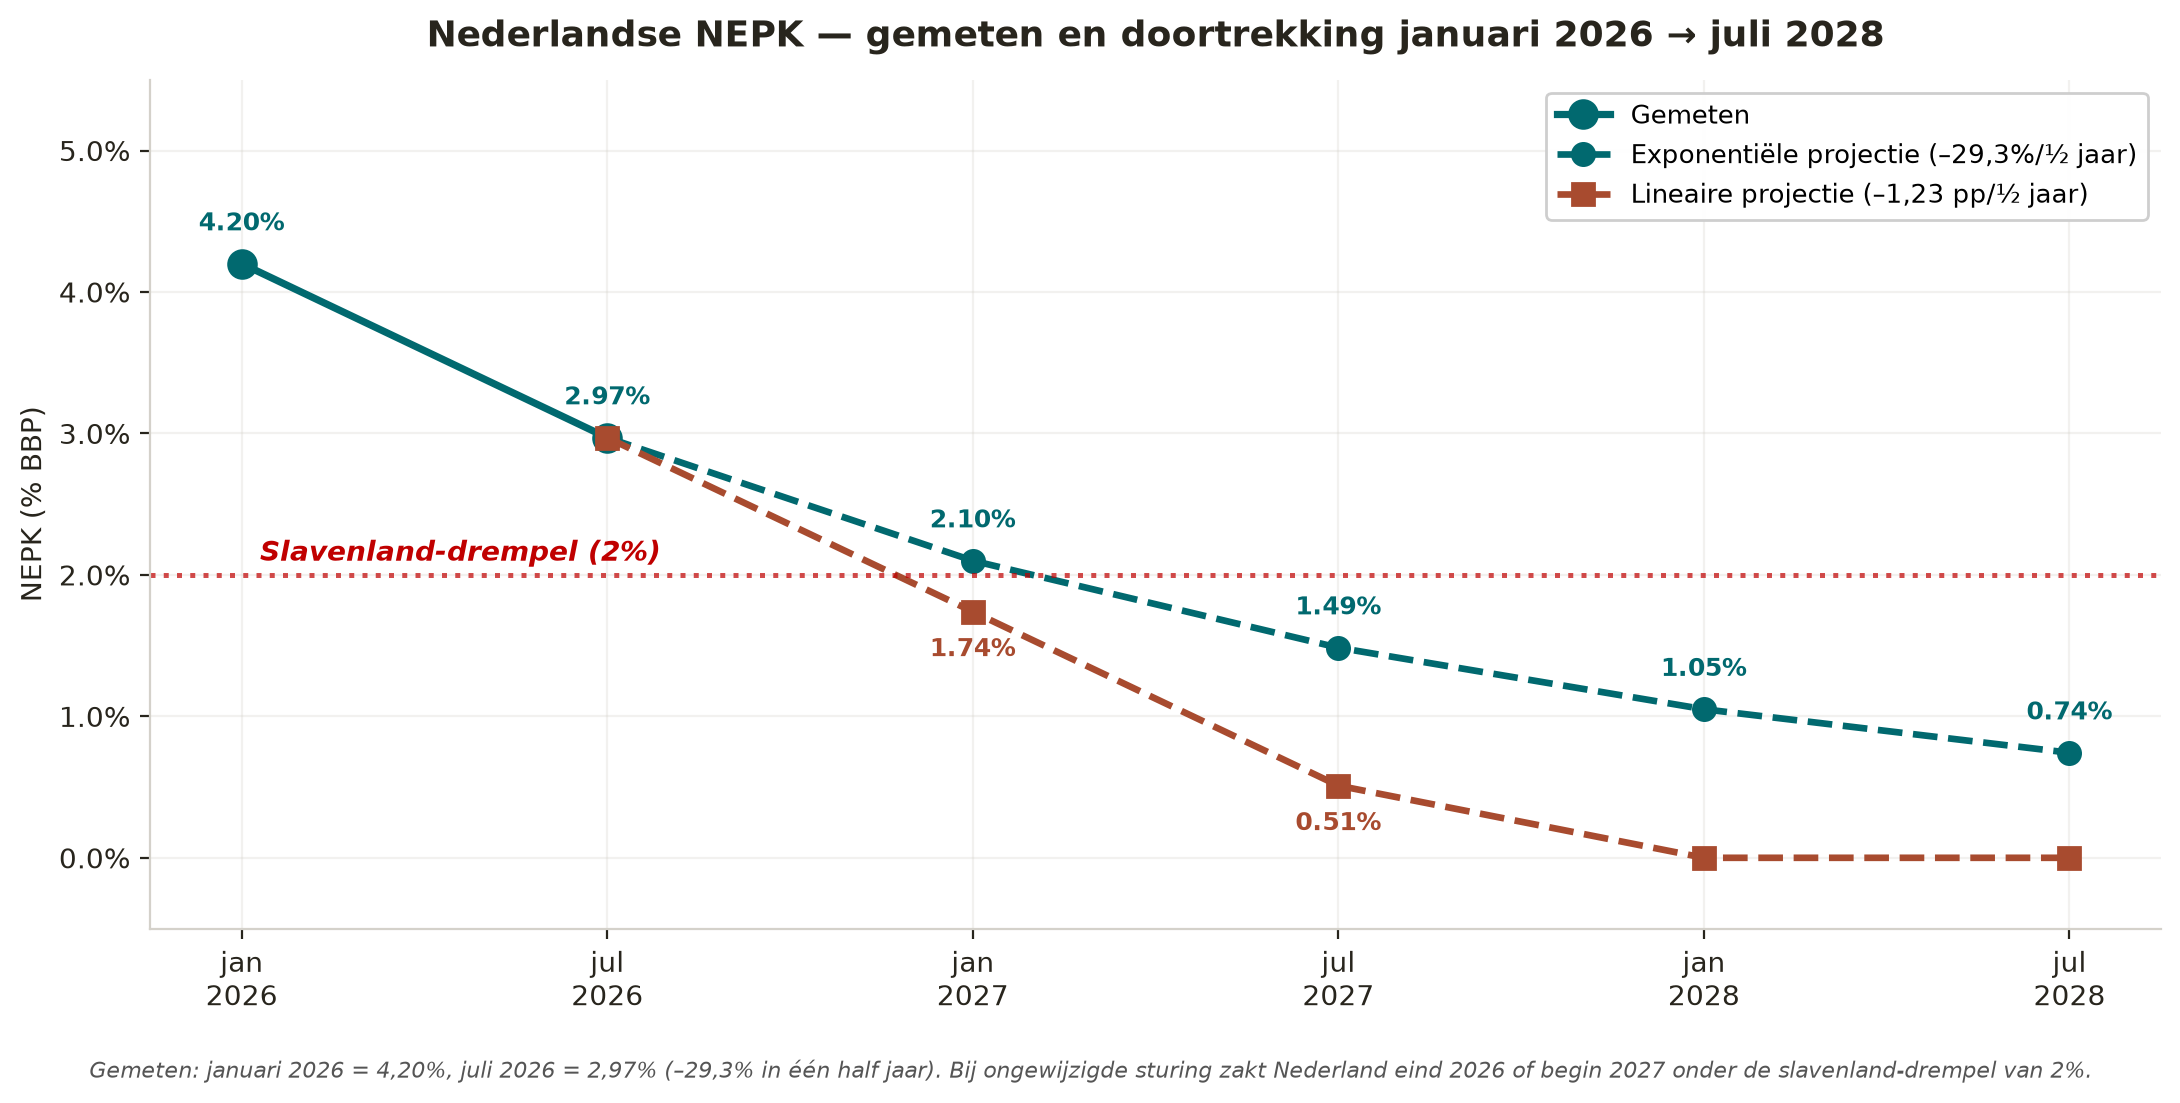
What if the decline continues at the same speed? Two simple extrapolations based on the measured values of January 2026 (4.20%) and July 2026 (2.97%):
- Linear (−1.23 percentage points per half-year): January 2027 = 1.74% — already below the slave-nation threshold; July 2027 = 0.51%; mid-2028 zero.
- Exponential (−29.3% per half-year): January 2027 = 2.10%; July 2027 = 1.49% — threshold then breached; July 2028 = 0.74%.
Both extrapolations fall below the 2% threshold within 6 to 12 months. What does “below 2% NEPK” mean?
“Developing country” is the common term, but it does not cover the situation. A developing country has potential and usually a growing productive base — it still has to build up. The Netherlands with NEPK <2% is the opposite: a country that had a productive core and lost it. The correct term is slave nation.
A slave nation surrenders its production capacity to foreign ownership and performs domestic labour largely for the account and at the discretion of foreign owners and institutional investors. φ (national ownership) is too low to reserve the country's own productive stream for its own population. Concretely, this means:
- Workers work for “foreign payroll” — their productivity gains flow through dividends, licensing and management fees to non-Dutch owners.
- Pension accrual is tied to foreign equities and bonds — one's own pension becomes a claim on the production of others, not one's own.
- Housing sits with foreign or foreign-financed institutional owners (Blackstone-like structures, foreign real-estate capital) — housing becomes structural renting from abroad.
- Energy, chemicals, machine building and logistics lie in the hands of foreign corporations — production decisions are made outside the Netherlands, not by the Dutch.
- Even the €32 billion of agricultural exports to Germany lies partly in the hands of non-Dutch food conglomerates — the farmer produces, but the margin flows out.
Concrete consequences once the Netherlands falls below 2%:
- Foreign financing becomes more expensive — rating agencies regard domestic productive ownership as a creditworthiness basis; the φ decline pushes the rating down in steps.
- Pension funds come under pressure — returns on domestic productive assets shrink, while foreign assets are denominated in foreign currency.
- A capital-flight feedback loop begins — larger Dutch family businesses and SME-linked wealth relocate to jurisdictions with a higher NEPK base.
- The purchasing power of social transfers evaporates — without a productive core there is nothing left to pay out transfers without further government debt.
- Political instability becomes endogenous — steering by voter behaviour makes structural production policy impossible, which reinforces the decline itself and entrenches the slave-nation condition.
In short: the extrapolation shows that on the current course — without an external shock, purely through continuation of the current, voter-behaviour-driven government — the Netherlands reaches the slave-nation condition within a single government term. This is not a speculative scenario; it is a linear projection of the decline already measured from January to July 2026.
7.9 Why the slave-nation condition does not hold — two groups that reject it
The slave-nation condition is not stable, because two groups that normally oppose each other both reject it — for opposite motives, but converging in political outcome.
The ordinary Dutch citizen does not want to be a slave-nation population. Working for foreign payroll without ownership, renting housing from foreign funds, pension accrual as a claim on the production of others — this is a loss of dignity that cannot be offset by purchasing-power packages. The benefits distributed by the voter-behaviour government themselves become thinner as the productive core erodes further, so the trade-off of “slave-nation condition in exchange for sufficient purchasing power” does not hold.
The wealthy Dutch citizen does not want to support the slaves. If the productive core is so small that the wealthy segment must structurally carry, through taxes, the consumption of the non-productive segment, the arithmetic becomes untenable. There are two classic escape routes: emigration (capital and talent move to jurisdictions with a higher NEPK base) or political rupture (forcing a different governance model). Both are visible in the historical precedents.
When both groups exit simultaneously — the population out of legitimacy, the wealthy out of fiscal sustainability — the voter-behaviour government loses its base. What remains is a press arena.
In the six historical precedents (France 1789, Russia 1917, Weimar 1932, Cambodia 1975, Iran 1979, Venezuela 2013), the press produced division rather than diagnosis in every phase-2 endgame. Symptoms get sold politically as a question of blame — the wealthy against the population, the population against the wealthy — while the underlying cause (erosion of the productive core, falling α and φ) stays out of sight. In each of these six cases the government fell, and “heads rolled” in either the literal or figurative sense.
10. Crime cascade — the Marseille model
Unemployment of 11-12% combined with a loss of purchasing power in industrial regions produces a predictable cascade of crime, territorial decay and institutional erosion. Historical precedents (Weimar 1929-1932, Greece 2010-2015, French banlieues 1985-present) show, in four phases, what follows.
10.1 Phase 1 (2026-2027) — silent erosion
- Property crime +15-25%: bicycle theft, copper theft (cables, gutters, church copper), car break-ins, ATM bombings. German PKS registration in 2023 already +5.5%, of which burglary +7.4% and juvenile crime +9.9%.
- Organised gangs fill the vacuum left by the eroding middle class: drug distribution via clan structures (Berlin, Essen, Duisburg — in 2024 already roughly 800 clan-related offences per month). These structures are crisis-resistant because forced loyalty replaces market loyalty.
- Undeclared work triples in catering, construction, courier services. Tax revenue τ falls, which pushes NEPK further down through the formula itself.
10.2 Phase 2 (2027-2028) — territorial zoning, Marseille effect
- No-go-zones per neighbourhood. Germany already has: Duisburg-Marxloh, Berlin-Neukölln (parts), Essen-North, Bremerhaven-Lehe, Gelsenkirchen-North, parts of Offenbach and Ludwigshafen. What is visible in Marseille (Quartiers Nord, Bassens, Kalliste — a risk zone after 8pm) is exactly the pattern developing in the Ruhr area and North Berlin.
- The police effectively withdraw from patrol duty, limiting themselves to incident response. The German police union DPolG (May 2026): “we can no longer enter 40 neighbourhoods without backup”. That figure stood at around 8 neighbourhoods in 2019.
- The wealthy population relocates to gated-like solutions: Zehlendorf, Grunewald, Bogenhausen, Königstein. The price gap versus crisis neighbourhoods doubles (already a factor of 4-5× per m² now).
- Public space shrinks to daylight hours. Nightlife concentrates in guarded enclaves.
10.3 Phase 3 (2028-2030) — institutional erosion, Venezuela scenario in slow motion
- Ambulances, fire brigades and parcel couriers refuse certain addresses. In Berlin-Neukölln this has applied to parts since 2022; the pattern is spreading.
- Tax compliance falls. Undeclared work out of necessity becomes undeclared work as the norm. Greece 2010-2015: effective tax compliance fell from 80% to 55% — Germany follows the same curve in a prolonged crisis.
- Small shops close in affected neighbourhoods (Aldi/Lidl remain, DM/Rossmann withdraw, specialty retail disappears). Food deserts as in US Rust Belt cities.
- Public facilities (swimming pools, libraries, sports clubs) close due to budget and security problems. The social fabric that supports production (club life, volunteering, care) falls away.
10.4 Phase 4 (2029-2032) — political rupture, Weimar echo
- Extremist parties (AfD, BSW, new radical newcomers) together over 40%. Nationwide coalition-forming impossible without breaking the firewall. In the September 2024 elections in Saxony/Thuringia: AfD already reached 30-33%, BSW 12-16%. Westward spread to North Rhine-Westphalia and Baden-Württemberg is the next warning sign.
- State-level coalitions lose steering power: every reform plan gets blocked by a coalition partner afraid of voter backlash. Exactly the pattern of Weimar 1930-1932.
- Bundeswehr deployment on domestic soil: Basic Law Article 87a permits deployment in case of “internal emergency”. The discussion about this takes place between 2027-2029. A precedent would break with the post-war consensus.
- Calls for a strong leader among SMEs and business: IfD-Allensbach May 2026 shows 42% already saying “we need someone who restores order” — in 2018 it was 22%.
10.5 Transmission to the Netherlands
The Netherlands still has low unemployment (3.9% in 2025), but the NEPK plunge to 2.97% points to the same underlying erosion 6-12 months behind Germany. Marseille-type phenomena are already visible here: parts of South Rotterdam, Amsterdam-Nieuw-West, Utrecht-Overvecht, East Helmond, Kanaleneiland. Liquidation violence in Amsterdam-North (Mocro-mafia, Taghi structures) is the already-visible forerunner. In a German recession spilling over here, this accelerates.
10.6 Historical parallels
This cascade is not speculation but pattern recognition from four historical cases:
- Weimar Germany 1929-1933: 6% unemployment (1929) → 30% (1932). Street violence phase 1 (1930), political murders phase 2 (1931), Reichstag fire phase 3 (1932), Machtergreifung 1933. Roughly 42 months from crisis onset to total rupture.
- Greece 2008-2015: debt crisis → 27% unemployment → territorial decay of Athens (Exarchia, Omonia), rise of Golden Dawn (far right) + Syriza (far left) → capital controls and bailout 2015.
- French banlieues 1985-present: slow-motion version without an acute crisis. Shows what happens when a medium-sized country learns to live with de-industrialisation without breaking the pattern — by now permanently around 10% of the territory under de facto different jurisdiction.
- Venezuela 2013-2022: Caraqueño scenario in the extreme case, accelerated by the oil price collapse. Public safety, healthcare and the currency system implode together within roughly 5-7 years.
Germany at the end of 2026 most resembles Weimar 1930 (two years before the rupture) in terms of unemployment and NEPK decline. The Dutch position at the end of 2026 resembles France 2005 (shortly before the banlieue riots) in crime indicators, and Greece 2009 in debt position (see 12.1).
11. Union dynamics and revolution timing
According to historical precedents, the timing of the phase transition lies between 18 and 42 months after crossing 10% unemployment combined with an income shock. For Germany this implies a revolutionary breaking point between mid-2029 and end-2031; the Netherlands follows 6-12 months later, i.e. 2030-2032.
11.1 Historical benchmarks
- Weimar: unemployment above 10% end of 1930 → Machtergreifung January 1933 (26 months).
- France 1789: bread crisis October 1788 → Bastille July 1789 (9 months — fast, because elite defection ran alongside it).
- Russia 1917: war exhaustion end of 1915 → February Revolution 1917 (14-16 months after the grain shortage).
- Iran 1979: Black Friday September 1978 → Khomeini February 1979 (5 months — accelerated by a ready-made clergy network).
- Venezuela: Chavista crisis 2013 → street violence 2017-2019 (longer, strong repressive apparatus).
11.2 The role of unions — accelerators or brakes?
Unions can play two opposing roles. In Germany, both forces are active.
- IG Metall already organised several mass strikes at VW and Bosch in 2024-2025. When the 50,000 VW layoffs were announced, nine VW plants shut simultaneously in December 2024 — a phase-1 signal.
- Above 8% unemployment, IG Metall shifts from wage strikes to preservation strikes: closure blockades, plant occupations. Precedent Opel Bochum 2004 (6-day occupation). By 2028-2029 this becomes standard repertoire.
- Solidarity strikes are becoming more likely. Ver.di (services) and GdP (police) already coordinated in 2024-2025 — the coordination structure exists.
- General strike: if IG Metall + ver.di + EVG (rail) strike simultaneously for 2-3 days, German logistics grinds to a halt. In Weimar 1932 exactly this pattern occurred in the phase-1 endgame.
Acceleration role (Weimar/France model):
- German unions are traditionally a co-management party (Aufsichtsrat seats, Betriebsvereinbarung). Street action is not their natural repertoire.
- In major crises they historically opt for the sozialverträgliche Lösung — early retirement, transfer companies, part-time work — rather than escalation. Coal exit 1990-2018: 500,000 jobs gone, not a single revolutionary action.
- Union leadership has an interest in the continuity of the system in which it holds a position. Escalation costs them that position.
Braking role (co-management/Mitbestimmung DNA):
11.3 What determines which role becomes dominant
The union chooses acceleration when three conditions coincide: (1) the rank and file outpace the leadership, and wildcat strikes arise outside the official mandate; (2) the negotiating partner no longer delivers what the leadership can sell to the rank and file; (3) competing movements pull the union's base away from it.
All three are already underway:
- Wildcat strikes: still limited, but driver-strike-like actions in logistics/courier/Uber-type models occurred three times in 2024-2025 without ver.di mandate.
- Negotiating partner not delivering: the Merz government (March 2025-) has no production policy and offers IG Metall no structural narrative. The union cannot sell “we achieved something”.
- Competing movements: BSW (Wagenknecht) actively pulls workers away from IG Metall/SPD. The AfD has a workers'-wing structure in eastern Germany. At 12% unemployment these become mass catchers.
11.4 Forecast by phase
- 2026-2027: unions still in braking mode, but rising wildcat strikes and rank-and-file discontent. IG Metall loses 5-10% of membership per year. Phase of internal struggle.
- 2028: turning point. With unemployment ≥ 8% and 3+ major employers in crisis simultaneously (VW + Bosch + Thyssenkrupp), IG Metall can no longer brake without losing its base to BSW/AfD. Transition to fighting mode.
- 2029-2030: coordinated general strikes (72-96 hours) become likely. Not revolutionary actions in the strict sense, but government-toppling (France 1968, Polish Solidarność 1980).
- 2030-2031: if no orderly correction has occurred by then, the initiative shifts from unions to non-union movements (youth, second-generation migrants, neighbourhood organisations). French revolutionary pattern (1848/1871, Paris Commune): the union becomes too old, too system-bound, and is overtaken.
11.5 The real revolutionary phase comes after the union, not through it
Weimar 1932-1933: SPD unions tried to organise a general strike against the Preußenschlag in July 1932. It failed because the rank and file had already been hollowed out by 30% unemployment. Two years later the Machtergreifung took place without union resistance. This pattern repeats: unions accelerate phases 1-2 (wage protest, strikes), but are irrelevant in phases 3-4 (political rupture).
For Germany: 2027-2028 marks the peak of union struggle. After that it shifts to political street organising. 2029-2031 is the window for the actual rupture — no longer through IG Metall, but through BSW/AfD/new informal movements.
For the Netherlands: FNV and CNV are even further in braking mode than IG Metall, so the union phase is shorter, and the breaking point arrives via other channels (farmer protests, SME anger, tenant protest, Groningen). The timing lags Germany by 6-12 months: 2030-2032.
Summarised in one sentence: the revolution does not come through the unions — the unions are the last brake to break. When IG Metall loses its base to BSW/AfD in 2028-2029, the last institutional buffer disappears, and the remaining 18-24 months constitute the phase transition.
12. Real debt-to-GDP — why it can go much faster
The timing in Section 11 (Germany 2029-2031, Netherlands 2030-2032) assumes the official EMU debt ratios. These conceal most of the fiscal vulnerability. Once corrected for the real debt position, the breaking point shifts significantly forward.
12.1 Netherlands — from 43% official to 193% real
Correction based on official sources (Algemene Rekenkamer, CBS, CPB, DNB, Bundesbank equivalents):
- Official EMU debt 2024: 43.3% GDP = €463 bn.
- AOW future obligation (present value): 47% GDP = €503 bn. Source: CPB / CBS ageing study.
- Wlz + Zvw uncovered future obligations: 25% GDP = €268 bn. Growth in care demand without covered financing.
- Outstanding central government guarantees: €470 bn = 44% GDP. Source: Algemene Rekenkamer annual report 2024. Includes WSW guarantee (housing associations), NHG, EKV export credit insurance, equity stakes.
- Climate and infrastructure obligations (climate agreement, grid bottleneck solution, water security): €200 bn = 19% GDP.
- TenneT / Gasunie / DNB structural losses and capital needs: €110 bn = 10% GDP. DNB has announced losses for 2024-2027 due to ECB interest rate policy; TenneT's capital needs for grid expansion are not covered by the regular budget.
- EU transfers and guarantees (NL share): €54 bn = 5% GDP. NGEU, ESM repayments, EU budget obligations.
Cumulative hidden total: €1,604 bn = 150% GDP. Real debt-to-GDP NL 2025: €2,067 bn = 193% GDP.
12.2 France — from 114% official to 524% real
France is the first major EU member state where the problem can no longer be hidden. Official EMU debt is already the highest among the large member states at 114% of GDP. Combined with implicit obligations, France exceeds 500%.
- Official EMU debt 2024: 114% GDP = €3,306 bn.
- Pension obligation (Conseil d'Orientation des Retraites, COR): 320% GDP = €9,280 bn. The French system is largely PAYG with 42 different régimes spéciaux. Reform attempts in 2019, 2023 and 2025 all failed politically.
- Healthcare uncovered (Sécurité sociale trend deficit): 35% GDP = €1,015 bn.
- Outstanding government guarantees (Cour des Comptes): €900 bn = 31% GDP. CADES, BPI-France, Bpifrance, ACOSS.
- Climate and infrastructure obligations: €400 bn = 14% GDP.
- EDF, SNCF, RATP structural losses and investment needs: €300 bn = 10% GDP. EDF was fully nationalised in 2022 for €9.7 bn, but carries €65 bn of debt on its own balance sheet plus over €100 bn of investment for extending nuclear plants and new builds. SNCF debt is structurally uncovered.
Real debt-to-GDP France 2025: 524% GDP = €15,200 bn. This is why markets have priced France with a widened spread since July 2024 (Macron's parliamentary dissolution): the 10-year OAT yield stands at 3.4-3.7% in July 2026 versus German Bunds at 2.7%. A spread of 70-100 basis points is the highest since the euro crisis of 2012 and points to an emerging risk perception.
12.3 Germany — from 62% official to 470% real
The Bundesbank and IW Cologne published various studies on implicit obligations between 2019-2023. The most important item is the statutory pension system (Rentenversicherung), which, unlike the Netherlands, is largely PAYG (pay-as-you-go) and therefore must draw future contributions from future GDP.
- Official EMU debt 2025: 62.5% GDP = €2,794 bn.
- Rentenversicherung obligation (present value of future benefits minus future contributions): estimated 350% GDP = €15,645 bn. Source: Freiburg study (Raffelhüschen, annual update) and IW sustainability calculations.
- Gesetzliche Krankenversicherung + Pflegeversicherung uncovered: 30% GDP = €1,341 bn.
- Guarantees (KfW, states, Sondervermögen — the portion not covered by the debt brake): €800 bn = 18% GDP.
- Climate Sondervermögen and energy infrastructure (outside the March 2025 debt-brake reform): €500 bn = 11% GDP.
Real debt-to-GDP DE 2025: approximately 470% GDP. This is an order of magnitude higher than the EMU figure suggests, and explains why German policy, despite the March 2025 debt-brake reform (€500 bn infrastructure + €100 bn defence), has no room for production policy: the available portion is already committed to the projected deficit in implicit obligations.
12.4 How Covid accelerated the process
Between 2019 and 2024 official EMU debt rose sharply (NL 48% → 43% after a downward GDP revision; DE 59% → 62%), but implicit obligations rose much faster:
- Covid support measures (NOW, TVL, Kurzarbeit) consumed €80 bn (NL) and €400 bn (DE) of fiscal space without a productivity improvement — pure redistribution from the future to the present.
- ECB QE and negative rates temporarily dampened the interest bill, but with the 2022-2024 rate rise, interest costs on the increased debt mountain are now arriving. NL interest costs budget 2026: €15 bn = 3.6% of government expenditure; in 2019 it was 0.8%.
- Ageing is accelerating: the baby-boomer exit from the workforce began in 2020-2022 and peaks in 2028-2032. This lowers α (productive core) while simultaneously raising AOW/pension pressure — a double blow to the balance sheet.
- Climate transformation spending doubled between 2019 and 2025 without a corresponding productive output. What is booked as investment is largely replacement of existing capacity (coal → gas → sustainable) without a net addition to the productive core.
12.5 Acceleration logic — the interest-fiscal squeeze
At these real debt ratios, every percentage point of interest rate increase changes everything. Effects per country:
- +1 pp interest: €21 bn/year = 1.9% GDP (larger than the defence budget).
- +2 pp: €41 bn/year = 3.9% GDP.
- +3 pp: €62 bn/year = 5.8% GDP.
Netherlands (real €2,065 bn, 193% GDP):
- +1 pp interest: €210 bn/year = 4.7% GDP.
- +2 pp: €420 bn/year = 9.4% GDP — larger than the entire education budget plus defence combined.
- +3 pp: €630 bn/year = 14.1% GDP — fiscally untenable.
Germany (real €21,010 bn, 470% GDP):
France (real €14,500 bn, 500% GDP):
+1 pp interest: €145 bn/year = 5.0% GDP.
+2 pp: €290 bn/year = 10.0% GDP — Greece-2010 level of fiscal distress.
+3 pp: €435 bn/year = 15.0% GDP — default zone.
The ECB is caught in a squeeze: cutting rates ignites inflation (energy prices structurally high, wage-price spiral in services, migration effects on housing prices). Raising rates breaks the fiscal position of France and Italy and thereby the eurozone. Every way out worsens one of the two problems.
Historical precedent at a real debt ratio above 150%: Italy 1992 (Black Wednesday), Greece 2010 (bailout), Argentina 2001, Turkey 2018. The time between “everything still under control” and “confidence crisis” was 6-18 months in all cases, not 3-5 years. The trigger is usually an external shock (Russia 1998, Lehman 2008) or a political event (Greek elections 2009, French dissolution 2024).
France is the critical weak link in the current system. At a French spread of 200 basis points (Greece's initial 2010 level), the 10-year OAT rises to 4.7-5% — an additional fiscal burden of €66 bn/year. At an Argentina-2001-style shock (spread 800 bp), the interest rate reaches 11% and additional costs reach €264 bn/year = 9% GDP: at that point France is technically insolvent. And a French crisis would drag down other eurozone debt levels — Italy 137% official, Belgium 103%, Spain 106%. Germany and the Netherlands would then be forced to conduct rescue operations via the ECB/ESM, further raising their own real debt ratios: a negative feedback loop.
12.6 Revised timeline with debt-ratio effect
The timing from Section 11 (breaking point DE 2029-2031, NL 2030-2032) assumes gradual erosion without an interest-rate shock. Taking the real debt ratio into account creates a second acceleration channel:
- At 8% unemployment (Germany expected in 2028 under Scenario B), €40-60 bn of tax revenue disappears and social spending rises by €30-50 bn. Net effect on the budget deficit: +2-2.5% GDP.
- At a deficit above 3% GDP, the EU's excessive-deficit-procedure (EDP) kicks in. Mandatory austerity measures reinforce the recession (Fiscal Compact 2012-crisis, Greek troika model).
- Rating agencies (Moody's, S&P, Fitch) downgrade when the real debt ratio grows by 10+ pp per year. NL currently has an AAA rating, DE has AAA — loss of the AAA rating adds 30-80 basis points of interest cost = €5-15 bn additional cost per year.
- Feedback: higher interest costs push α further down via the burden rate, lower NEPK, accelerate capital flight, accelerate the φ decline, accelerate the slave-nation condition.
With this acceleration channel, the following timeline emerges:
- France: as the first domino. Breaking point 2026-2027 likely. Rating downgrade already underway (S&P December 2024 to AA-). A new election in 2027 could produce an RN majority, which markets would read directly as a default signal. The French would then bear the first political rupture in a major EU country since Greece 2015.
- Germany: breaking point not 2029-2031, but 2027-2029. Rating downgrade likely 2026-2027. EDP procedure 2027. Political rupture 2028-2029. Additional squeeze: if France falls, Germany must rescue via ECB/ESM, pushing Germany's real debt ratio up 5-10 pp — self-reinforcing.
- Netherlands: breaking point not 2030-2032, but 2028-2030. Grid-bottleneck financing triggers a budget crisis in 2027-2028. NEPK already below 2% by end-2026 per Section 7.8. Government collapse amid failed coalition-forming in 2028 is the most likely breaking point. Earlier in the event of a French-German cascade.
The real debt ratio does not make the phase transition heavier — that weight was already built in — but faster and coupled. France-first-then-Germany-then-Netherlands is a cascade of 12-24 months per step. Every month that passes without production policy lowers α and raises real interest costs simultaneously — exponential erosion, not linear, and correlated among neighbouring countries rather than independent.
If interest rates actually rise (and that is the most likely outcome given the ECB squeeze, US tariffs, energy prices, defence spending), it will not happen at the historical pace of years, but in months. The French OAT spread from July 2024 to July 2026 (doubled) is the first warning flare. The next warning flare (spread to 150 bp or higher) could be the starting gun for a eurozone-wide phase transition — with all four countries (FR, IT, DE, NL) on the same timeline instead of staggered.
13. Straight talk — what a government should say
The entire analysis in this report (NEPK decline, industrial layoffs, insolvencies, crime cascade, union dynamics, real debt ratio, interest-rate acceleration) leads to a common cause: no government tells the population the truth about the fiscal, productive and demographic position the country is in. What a government should say, and why it does not happen.
13.1 What the population has a right to know
An honest Dutch government statement in 2026 would explicitly name the following facts:
- The official debt ratio of 43% of GDP is not a reflection of the fiscal position. The real debt ratio including AOW, healthcare, guarantees and climate obligations stands at 193%. That is a higher debt position than Italy officially has.
- The pension system is not funded for ageing. The announced system change (Wet toekomst pensioenen) shifts the risk from funds to participants, but does not solve the underlying demographic problem.
- The economy's productive core (NEPK) halved between January and July 2026. On unchanged policy, the Netherlands falls below the slave-nation threshold by the end of 2026.
- The purchasing power still being distributed by the government via tax relief and subsidies comes from future generations — it is not a productive gain, it is accelerated consumption of children and grandchildren.
- The climate transformation costs more than officially budgeted, and its benefits only arrive after 2035 — if at all. Between now and then, the costs must be financed from current consumption or new debt.
- The Netherlands' international position is weakening at an accelerating pace: the German recession hits Dutch exports, French debt risk hits Dutch ECB exposure via the banks, US tariffs hit Rotterdam throughput.
13.2 What an honest government should propose
Given this diagnosis, a responsible government would have to propose four measures simultaneously:
- NEPK targeting in the budget. Every budget contains an explicit NEPK trajectory with α, φ, τ and E_tv as steering variables. Policy is measured by its effect on these four — not on purchasing-power levels.
- Real debt-ratio reporting. Alongside the EMU debt ratio, the state budget publishes the real debt ratio annually, including the AOW future obligation, uncovered healthcare obligations, guarantees and climate obligations. The population has a right to the full balance sheet.
- Production investment programme. A ten-year programme of €15-20 bn per year in productive infrastructure: grid expansion, bio-based chemicals (BiCRS cluster Groningen), horticulture modernisation, skilled-trade industry. Cooperative ownership structures anchored in law, no quarterly pressure from foreign shareholders.
- Bundesrat-like structure. Seats reserved for farmers, SMEs, skilled workers, inventors and bio-based entrepreneurs. Route 4 from the Openvizier Nova Democratia model: no additional bureaucracy, but a guarantee that productive voices structurally co-decide alongside party politics.
13.3 Why it does not happen — the steering logic of voter behaviour
No Dutch government in the last 20 years has poured this straight talk. The reason is not that politicians do not know — most know the figures. The reason is that the steering logic is structurally blocked:
- Four-year election cycle. Every measure that is painful in the short term and beneficial in the long term costs seats. Rutte III (2017-2021) could not carry out pension reform because the VVD base saw it as an attack. Rutte IV (2022-2023) foundered on migration before NEPK steering even entered the debate.
- Coalition pressure. A six-party coalition cannot choose a structural side — every proposal runs into one of the partners. The result is a policy that does a little bit of everything everywhere and nowhere enough to steer.
- Press arena. Talk shows and opinion media judge politicians on incident and emotion, not structure. Anyone explaining the real debt ratio in four minutes of talk-show time comes across as a “doom-mongering technocrat”. Anyone handing out a subsidy comes across as a “cabinet with heart”.
- Ministerial risk aversion. Ministries work with scenario cabinets that assume “unchanged policy”. Analyses that call this untenable get internally softened to “requires attention”. What reaches politics via the CPB and the budget is filtered to what is coalition-negotiable.
- Government-opposition interaction. Any opposition party that picks up the real figures is dismissed by government parties as a “doom prophet”. Any government party that picks them up breaks with its own coalition. A systemic immune reaction.
13.4 The actual outcome — and the role of the citizen
What happens instead of straight talk is the creeping erosion this report documents: NEPK decline, growing debt position, industrial contraction, crime cascade on standby, union radicalisation building up. Every incident is treated separately (“Rotterdam ports”, “Groningen”, “nitrogen”, “pensions”, “farmer protests”), while they are all manifestations of the same underlying NEPK erosion.
The citizen's role in this situation is more complex than “vote better”. The political system does not deliver straight talk, and will not do so — as the above analysis of the steering logic shows. What a citizen can then do:
- Know the figures themselves. Do not trust what a minister says about the budget, but understand the calculation of the real debt ratio yourself (this report contains the sources). A citizen who knows the figures can no longer be soothed by purchasing-power charts.
- Build cooperative alternatives. What the state can no longer steer (productive investment, bio-based economy, farmer cooperatives) must arise from society itself. Every cooperative farm, every bio-based start-up, every local energy project raises the Netherlands' α by a small amount.
- Keep stating the public diagnosis. As long as the press arena produces division (the wealthy vs. the population, farmers vs. nature, SMEs vs. the state), the shared underlying cause disappears from view. Whoever keeps naming the diagnosis publicly keeps the possibility of an orderly correction open.
- Prepare for less orderly outcomes. If the orderly correction fails to materialise, the disorderly one comes. Individual preparation — limited bank debt, spreading of assets, local community ties, food security — is not a panic reaction but rational risk management given the historical precedents this report describes.
13.5 The circle closes
Sections 1-7 documented where the Netherlands and Germany stand economically. Section 8 drew a conclusion on Germany's position. Sections 10-11 showed what happens without intervention: crime cascade, union radicalisation, historical precedents. Section 12 showed that, via the real debt ratio and the interest-fiscal squeeze, it can go faster than expected. Section 13 shows why the steering system does not deliver the honest message — and what is then left to the citizen.
The circle closes here: there remains a technically feasible way out — the green recovery route, which appears as an addendum below in this report. But it will not be built from The Hague or Berlin. It must be built by farmer cooperatives, SME consortia, neighbourhood associations, bio-based start-ups and citizens who know the figures and have the courage to name them. The government follows only afterwards, once it has become politically unavoidable — that is the law of the phase transition, and it holds without exception in every historical precedent.
The choice is no longer whether the Netherlands and Germany experience this phase transition. That question is answered. The choice is: do we build the cooperative, bio-based, φ-protected structures ourselves, before the political rupture arrives, so that there is something to build on? Or do we leave that question to whoever controls the arena at that moment — with the historical precedents as a guide to what emerges from it?
9. Conclusion — the choice in one sentence
The German NEPK decline to 4.66% (2025) coincides with historically high insolvencies (24,064), 170,000 jobs lost to insolvency in 2025, and 235,400 announced industrial layoffs. The Netherlands follows the same crisis curve with a 6-12 month lag: unemployment from 3.5% to 3.9%, FTE loss through insolvency from 7,400 (2021 low) to 27,500 (2024 high), agricultural exports worth €32.0 billion directly exposed, and 45% of Rotterdam containers tied to the German hinterland. On top of this German pull comes an internal Dutch acceleration mechanism: NEPK fell within half a year from 4.2% (January 2026) to 2.97% (July 2026) — faster than the German decline from 5.10% to 4.66% over a full year, and the Netherlands has already fallen below the German level.
The extrapolation shows the Netherlands falling below the 2% threshold — the slave-nation condition — by the end of 2026 or early 2027. This condition is not stable: the population does not want to live in it, the wealthy do not want to pay for it, and the press arena amplifies the division between the two groups instead of making the shared diagnosis.
The choice is not between the slave nation and the current government — the current government is producing the slave-nation condition. The choice is between an orderly green correction now, or a disorderly correction later.
Addendum — The green recovery route (climate recovery plan)
What follows is not part of the crisis analysis above, but a separate addendum: the associated climate recovery plan from Openvizier — the green recovery route. We include it here because the question “what then instead” inevitably arises from the above diagnosis. This is the answer we at Het Open Vizier have long been developing, and which serves as a billboard for the climate recovery plan — not as a political forecast, but as a blueprint that farmer cooperatives, SME consortia and bio-based start-ups can begin working with today.
The hero figure at the top of this article shows two paths from the same low point (2.97%, July 2026). One: continuation of steering by voter behaviour and industrial contraction — sliding below the 2% threshold. The other: the green recovery route — a rising curve that charges up α, φ and E_tv simultaneously through biological production instead of consumptive transfers. This is not decoration in a chart. It is the only demonstrable way out of the trap, without a repeat of 1789 or 1932.
Why does nature work where industry no longer works? Because biological production has a fundamentally different cost structure. While German industry loses 10,000 jobs a month because energy is expensive and margins evaporate, biomass grows with sunlight and rain. Marginal costs fall as cultivation expands. And the production sits in Dutch soil and Dutch hands — which raises φ directly, instead of migrating to foreign owners.
8.1 Four concrete pillars
- Juncao production on Dutch and Wadden soil. Juncao (giant grass) produces 6-8 times more biomass per hectare than conventional arable farming, regenerates depleted soil within two years, and supplies raw material for protein, fuel, building material and carbon sequestration. On 100,000 hectares of marginal land, this yields ± 4 million tonnes of dry biomass per year — roughly €1.2 billion of new Dutch productive value, with φ = 100% if farmers remain cooperative owners.
- Moringa cultivation for nutrients and industrial protein. Moringa oleifera, grown in protected greenhouse cultivation, supplies a complete amino-acid profile for humans and animals. Replaces imported soy protein (the largest NL import from deforestation areas) and closes the protein loop within the domestic chain. Direct α boost, because the value stays in the Netherlands.
- Phytomining for critical raw materials. Certain plants (including specific Juncao varieties) hyperaccumulate metals such as nickel, cobalt and rare earths from polluted soils. Terraclean model: remediation becomes a source of income, because the harvested metals are sold on the world market while the soil recovers and returns to food production. Raises both α and φ simultaneously.
- BiCRS and the Carbon Alert model. Bio-based carbon capture with removal storage — biomass is fixed in sustainable products (building material, biopolymers) and underground. This is the only technology that simultaneously removes CO₂ from the atmosphere and delivers a tradeable product. The Dutch application in the Groningen-Delfzijl-Eemshaven triangle replaces the disappearing chemical turnover with a structurally higher margin.
8.2 Why this actually raises NEPK
Each of the four pillars acts simultaneously on multiple NEPK variables:
- α rises, because productive value creation arises within the Netherlands, with low overhead and no dependence on imported raw materials.
- φ rises, because cooperative ownership structures and farmer consortia secure domestic ownership — no quarterly pressure from foreign shareholders skimming the margin.
- E_tv rises in the long run, because bio-based products (biofuel, biopolymers, plant protein, sequestered carbon) form a growing export market — Germany and Belgium in particular are seeking these raw materials to greenify their own industry.
- τ can fall, because green production on marginal land can be fiscally encouraged without harming government revenue from the main flows.
As a model: if 15% of current Dutch agricultural land is converted to Juncao/Moringa cultivation under this model within 3-5 years, and agricultural exports to Germany shift from premium meat to plant protein, Dutch NEPK rises from 2.97% (July 2026) to above 5% by 2029 — higher than the German level of 2025.
8.3 What needs to happen politically
The green recovery route is not technically difficult and is economically attractive. It fails not on technology but on steering. As long as the cabinet steers by voter behaviour per month, no green programme can be built on the multi-year productive core. Three steering interventions are required:
- NEPK targeting in the budget. Every budget contains an explicit NEPK trajectory with α, φ, τ and E_tv as steering variables. Policy is measured by its effect on these four — not on purchasing-power levels.
- Bundesrat-like structure. Seats reserved for farmers, SMEs, skilled workers, inventors and bio-based entrepreneurs. This is Route 4 from the Openvizier Nova Democratia model: no additional bureaucracy, but a guarantee that productive voices structurally co-decide alongside party politics.
- φ protection policy. A strategic list of critical sectors (agriculture, bio-based, energy, chemicals, machine building), takeover screening for foreign acquisitions, cooperative law for farmers and SMEs, pension funds mandatorily allocating part of their assets to domestic productive holdings.
14. Sources overview
All URLs below are used per cell in the tables above.
- GDP and quarterly data — Destatis vgr110
- GDP annual confirmation 2022–2025 — Eurostat 22.04.2026
- Exports MNA series — ECB
- Exports 2025 — Destatis PE26_042
- Value added by sector — Destatis vgr210
- Government revenue — Eurostat via Apiar Data
- Government 2025 — Destatis PE26_017
- i.i.p. — Bundesbank June 2026 PDF
- i.i.p. Q1 2026 — Destatis IMF table
- Unemployment — Destatis lrarb001
- Insolvencies — Destatis lrins01
- Creditor damage — CRIF
- Damage 2025 — Europe-Data via Destatis
- Overview of company layoffs — The Local
- Fortune 500 layoffs — Fortune Europe
- VW Reuters source — Reuters
- NL exports to DE — CBS Dutch Trade 2024
- NL→DE total €210 bn — EC Recent Developments
- Rotterdam throughput 2024 — Port of Rotterdam
- Rotterdam hinterland 45% — Ballast Markets
- Groningen Seaports 2024 — annual report
- NL insolvencies annual totals — CBS 82242NED
- NL export value added 34–36% GDP — CBS 86068ENG
- NL agricultural exports DE — CBS 2024
- NL insolvencies 2025 annual total — FaillissementsDossier
- NEPK Climate Logic — Openvizier canonical formula
- WSWS 31.12.2025 — Germany economic crisis deepens as mass layoffs sweep industry