七つ道具 — The Seven That Made the Difference
Kaoru Ishikawa's seven quality instruments, plus order analysis from steel construction. The instrument with which Japan overtook us.
The instruments · 13 min read

Before I dissect three Dutch dossiers in this edition, I must first show the instruments I use to do so. They have a name, and that name is not Dutch. It is Japanese, it is old, and it refers to something that is never conveyed with its proper weight in our Western textbooks.
The Seven of Benkei
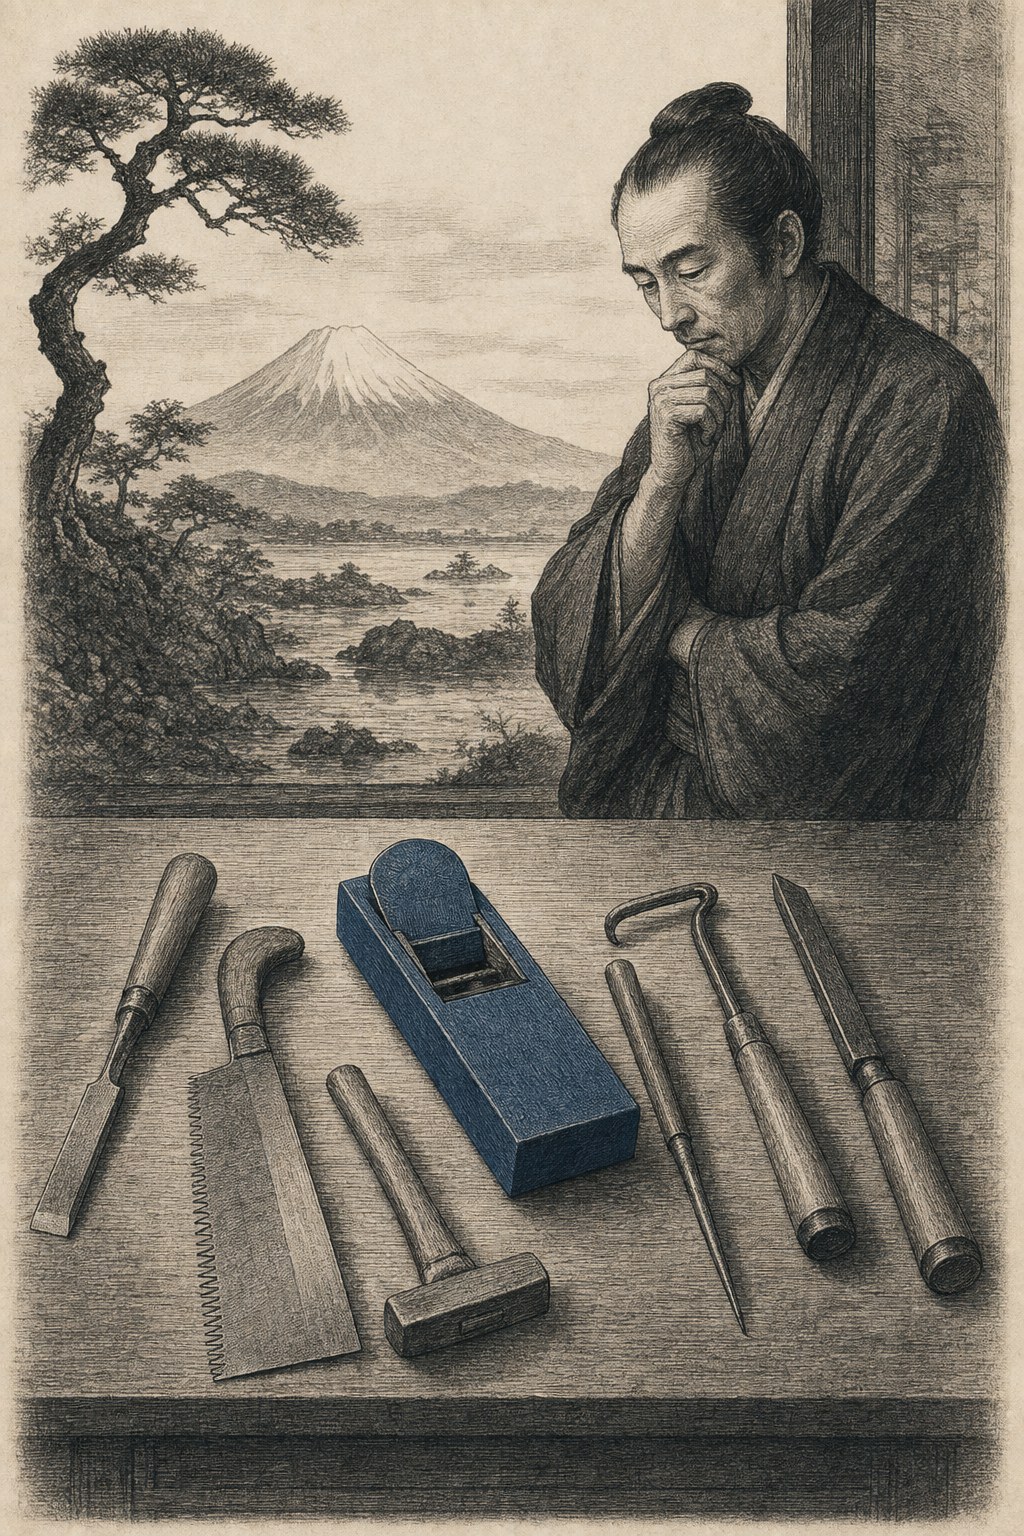
七つ道具 — nanatsu dōgu — literally means "the seven tools". In the Japanese industrial tradition the phrase refers directly to Kaoru Ishikawa's package of quality instruments, which he developed from 1949 onwards at the Japanese Union of Scientists and Engineers (JUSE). But the phrase is older. It refers to 弁慶の七つ道具 — Benkei no nanatsu dōgu — the seven weapons of Benkei, the legendary warrior monk of the twelfth century who, according to tradition, single-handedly defended the Uji Bridge against three hundred enemies. He possessed seven specific weapons, each with a specific function, and together sufficient to repel every attack — provided their user truly mastered them.
Ishikawa did not simply choose a list of seven at random. He invoked this mythological weight. The seven tools are not a list; they are an oath: seven related instruments, together sufficient to address any quality problem.
What the Package Is
Ishikawa did not invent the seven himself. The Pareto diagram belongs to the Italian Vilfredo Pareto (1906), brought into factory practice in modern form by the Romanian-American Joseph Juran (1951). The control chart belongs to Walter Shewhart (1924) at Bell Labs. The histogram is eighteenth century. What Ishikawa did do was assemble these seven into a single package — simple enough to teach to workers without a university education, and powerful enough to, as he himself wrote, solve ninety-five percent of quality problems on the shop floor.
In 1950 the American statistician W. Edwards Deming travelled to Tokyo, at the invitation of JUSE. In America he had been ignored; the post-war industry of his own country found his method superfluous. Japan listened. Deming donated his royalties to JUSE. With the proceeds the Deming Prize was established — still today Japan's most respected industrial prize. Then came Juran. Then Ishikawa developed the seven and the fishbone. In 1962 the first QC-circles started at the Nippon Wireless and Telegraph Company — voluntary shop-floor groups applying the seven tools to their own work.
In sixteen years that single initiative grew into one million QC-circles with ten million participating workers — nearly a quarter of the Japanese labour force. Ten million workers performing Pareto analyses on their own workplace every week.
It is this package that in thirty years turned a destroyed country into the world's second-largest economy. Here are the figures by country, in today's euros.
Japan
In 1965 Japan's nominal GNP stood at 91 billion dollars. In 1980, fifteen years later, 1,065 billion dollars. A twelvefold increase in fifteen years. Converted and corrected for inflation: from roughly 800 billion euros in today's purchasing power, to nearly 8 trillion euros. Average monthly consumption of urban households doubled between 1955 and 1970. A country that in 1945 had barely escaped hyperinflation had by 1968 become the world's second-largest economy, overtaking West Germany.
In 1989, four years before Deming's death, the American business press admitted what had long been denied: Japanese industry had caught up with American industry in quality and displaced it in market share. The American trade deficit with Japan reached 49 billion dollars that year — in today's purchasing power roughly 110 billion euros, one year, one bilateral relationship. The automotive industry, the electronics industry, the optical industry, the semiconductor industry: all taken over by companies — Toyota, Honda, Sony, Canon, Nikon, Panasonic — that had made the seven tools routine on their shop floor.
Toyota alone has operated the so-called Toyota Production System since the 1960s, which is in essence an extension of Ishikawa's package. Today Toyota is the world's largest carmaker by production volume, with a market value of well over 220 billion euros.
South Korea
Korea began twenty-five years later. In 1962, after the war and under Park Chung-hee's first five-year plan, GNP stood at 2.7 billion dollars — virtually nothing. In 1989, twenty-seven years later, 230 billion dollars. An eighty-fivefold increase. In today's euros a leap from roughly 25 billion to 470 billion euros in three-quarters of a human lifetime.
The chaebols — Samsung, Hyundai, LG, SK, Daewoo — adopted the Japanese model of quality circles almost directly. Samsung had its own Six Sigma programme by the late 1980s, building on Ishikawa's instruments. Hyundai applied fishbone analysis in its welding shops before it exported its first car to Europe. South Korea's GNP today stands at 1,870 billion dollars — nearly 1,730 billion euros.
Samsung alone represents roughly 23 percent of South Korean GNP in 2024 — approximately 400 billion euros. One company, grown from Ishikawa's QC tradition, is nearly equal to a quarter of a national economy. It is the most powerful single piece of evidence that the Japanese method did not work for one country alone, not for one culture, not for one period. It works wherever it is applied.
China
China took the step even more sharply. In 1978, the year Deng Xiaoping introduced the market economy, Chinese GNP stood at roughly 150 billion dollars — less than two percent of the world economy. In 2018, forty years later, 13.6 trillion dollars — eighteen percent of the world economy. A ninetyfold increase in four decades.
Between 1979 and 2008, productivity improvement — what the Japanese called kaizen, building on the seven tools — contributed more than eighty percent of the growth in output per worker. Not investment. Not labour expansion. Not economies of scale. But the targeted improvement of what the shop floor did daily, using instruments that Japan had developed and China had adopted. A country of a billion people lifted itself out of poverty in thirty years, and the primary factor was precisely the instrument that in our own society has been declared superfluous.
The Netherlands — What We Have Lost
A calculation, conservatively performed. Dutch GNP grew between 1990 and 2024 at an average of roughly 1.4 percent per year. Korean GNP grew over the same period at an average of roughly 5 percent per year — less than its peak decades, but still three and a half times our rate. If the Netherlands had grown at half the Korean pace over this period — not the full 5 percent but 2.5 percent — our GNP today would be around 1,700 billion euros instead of the actual 1,150 billion euros.
The difference — 550 billion euros — is what the Netherlands missed in thirty years by ignoring the instruments that were used elsewhere. Per inhabitant roughly 30,000 euros in income that never materialised. Per Dutch family of four: 120,000 euros that was not earned. Not because we lacked the capability. But because we discarded the tools with which others built it.
That is not a moral statement. It is a measurable ratio between those who used the seven tools and those who set them aside.
The Netherlands — Where We Would Stand If We Commit
But pain alone is not analysis. The question that truly matters is: where will we stand in thirty years if we pick up the tools this afternoon? Not as a thought experiment, but as an arithmetical projection based on what has actually been achieved in other countries.
Suppose the Netherlands were to introduce from 2026 onwards a productivity discipline comparable to that of Japan between 1955 and 1985 — not the growth figures of that era, which are no longer attainable for a developed country, but the discipline that caused the growth. A structural productivity improvement of 2.5 to 3 percent per year instead of the current 0.3 to 0.5 percent. That is neither a miracle nor a utopia; it is what Germany still achieves in its manufacturing sectors, what Switzerland has achieved for decades, and what Dutch petrochemistry and water management already achieve in those places where they do work with the method.
Projected over thirty years: a Dutch GNP of around 2,400 billion euros in 2056, instead of a probable 1,400 to 1,500 billion under unchanged policy. A bonus of roughly 900 billion euros relative to the continuation of the current trend. Per inhabitant: approximately 50,000 euros more income per year. Per family of four: 200,000 euros more per year than today.
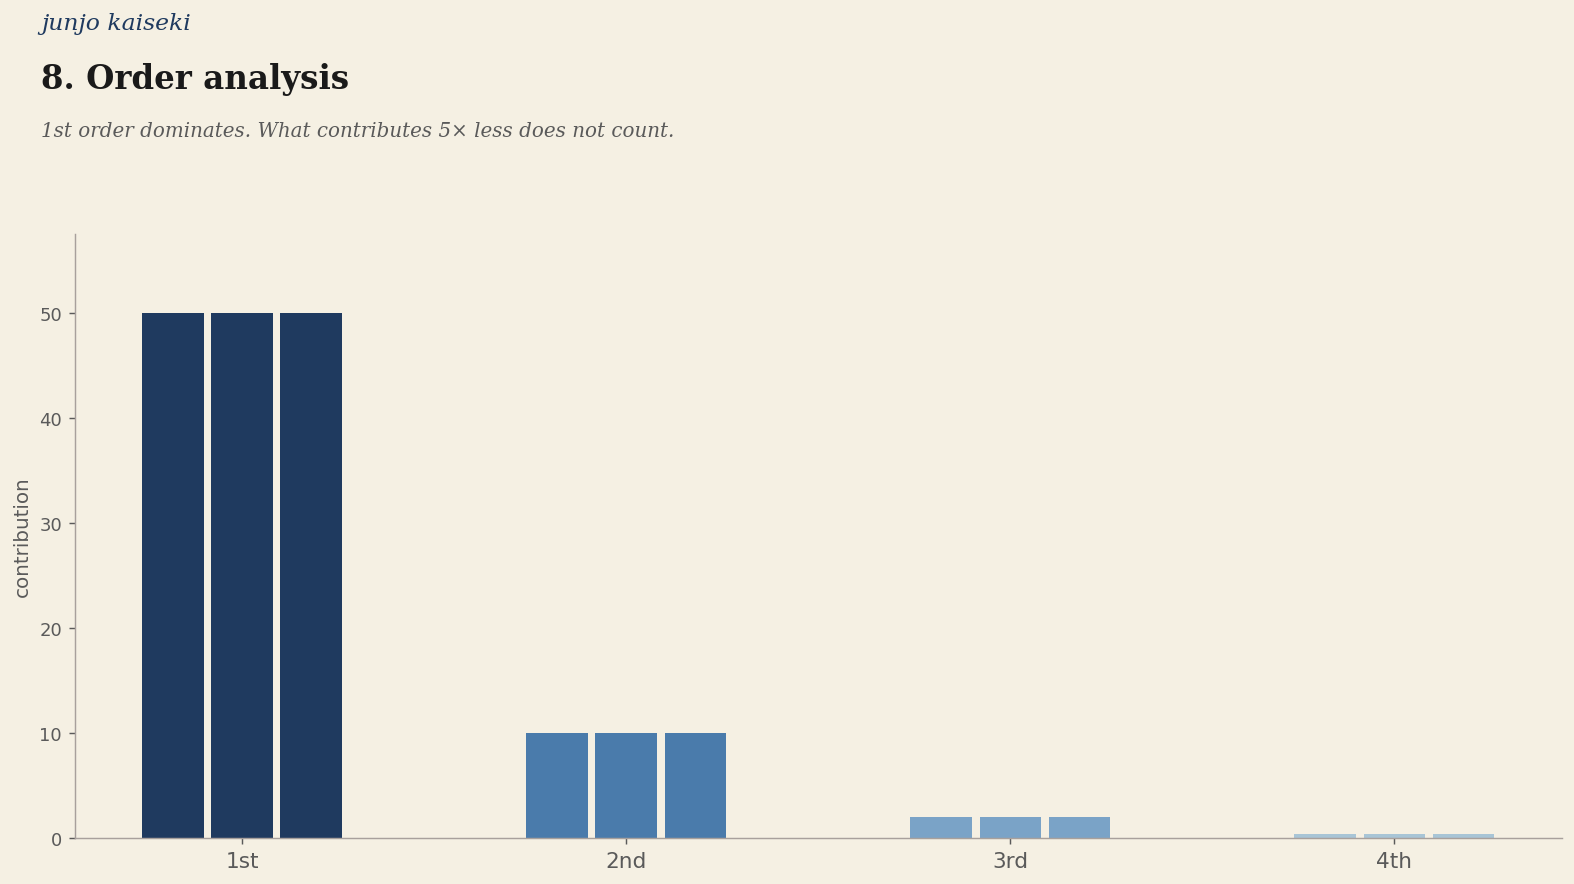
The question is not whether this is possible. Three peoples have already demonstrated it. The question is only whether we are prepared to muster the discipline they showed. For that no revolution is needed, no new party, no charter, no demonstration. All that is needed is the willingness to add one question to every administrative decision: what is the first-order factor here, and which factors weigh 5× less and therefore do not? Whoever asks that question honestly, at the service counter, in the consulting room, behind the desk of the inspector, in the council chamber and in the editorial office — that person has already picked up the seven tools. They may not even know it themselves.
This is what I hope this edition will bring about. Not that you agree with me. But that when you open the newspaper tomorrow, you ask one more question than you asked yesterday. That one question repeated in ten million hands is what in Japan between 1962 and 1980 generated one trillion dollars in prosperity.
That is what money is, in its most honest form. Money is an unintended consequence of the repeated asking of the right question at the right level by enough people simultaneously.
The Seven, Listed
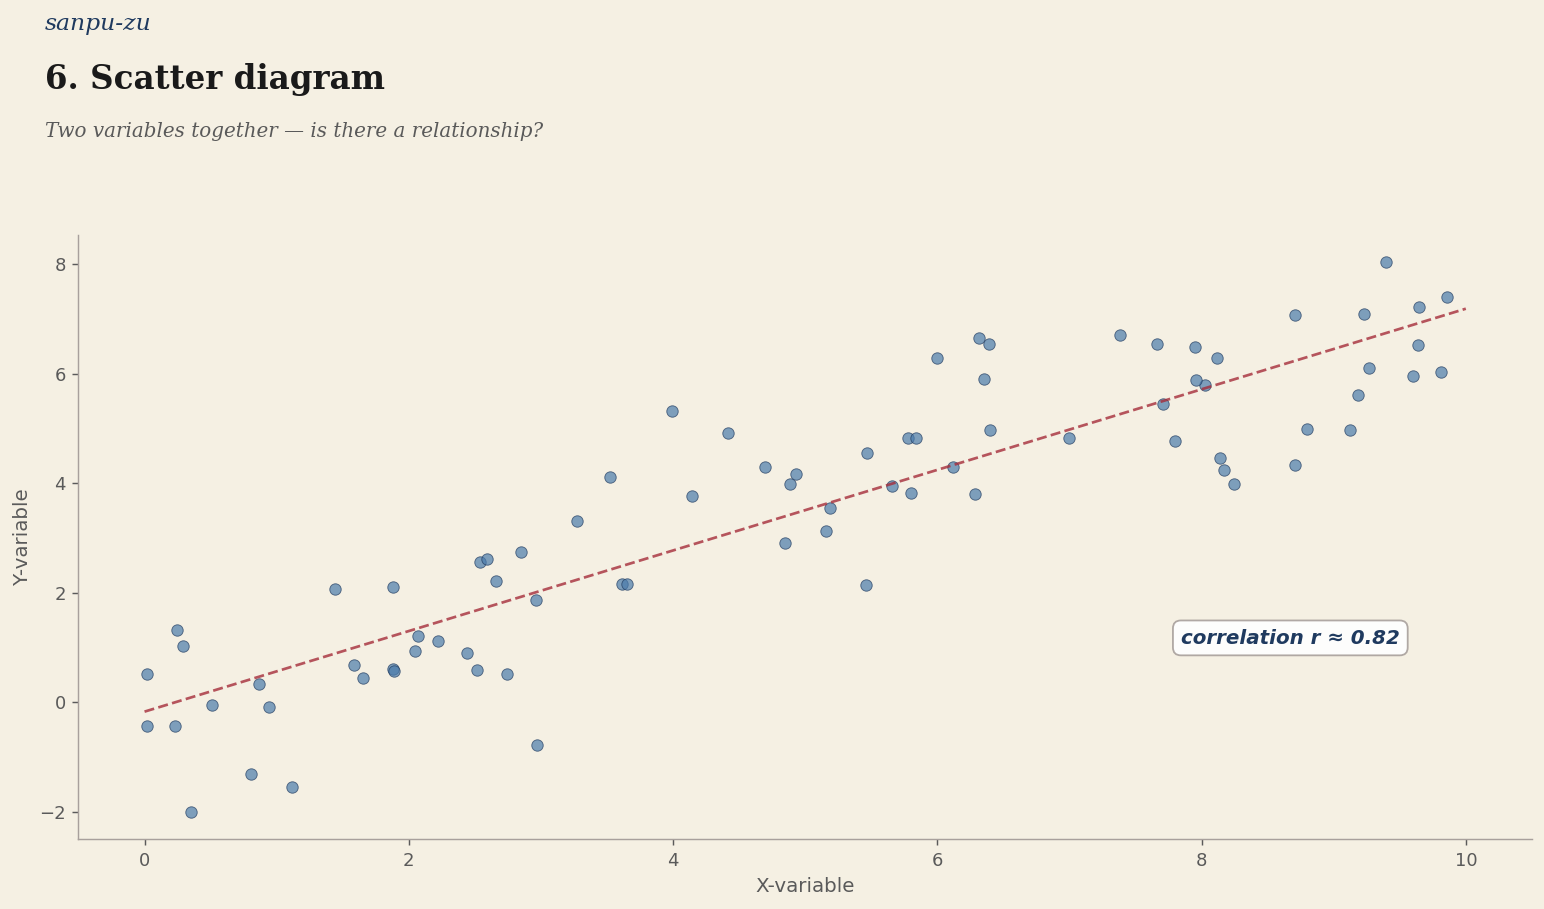
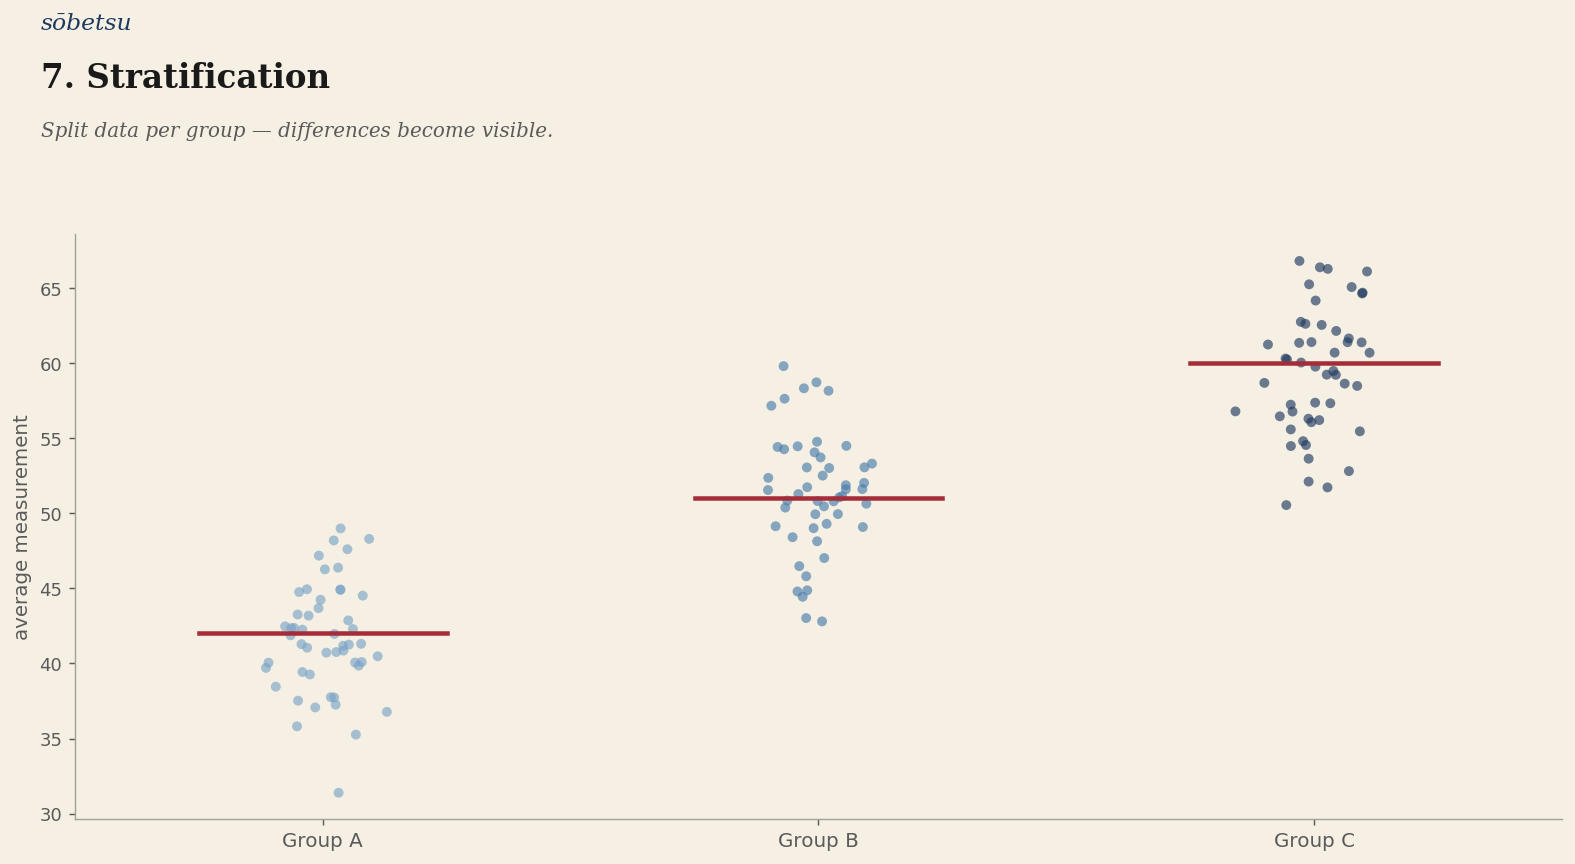
Below are the seven, in the order Ishikawa used in his book. At the bottom an eighth — not the equal of the seven, but a Western parallel I add from my own field, structural steelwork. Each tool has its own detail page; click through on the Japanese name to read the explanation and the Dutch practical example.
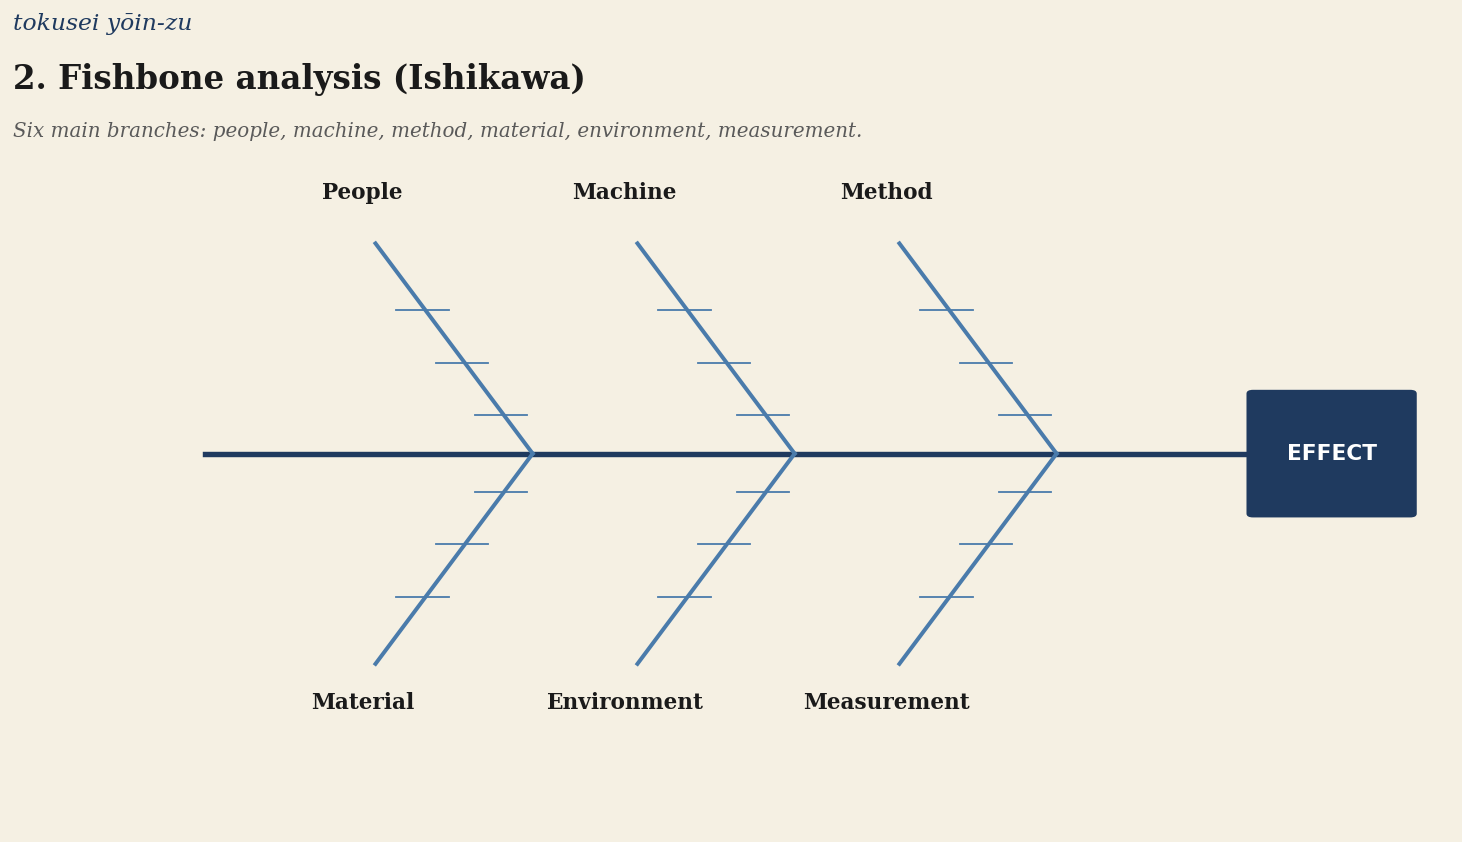
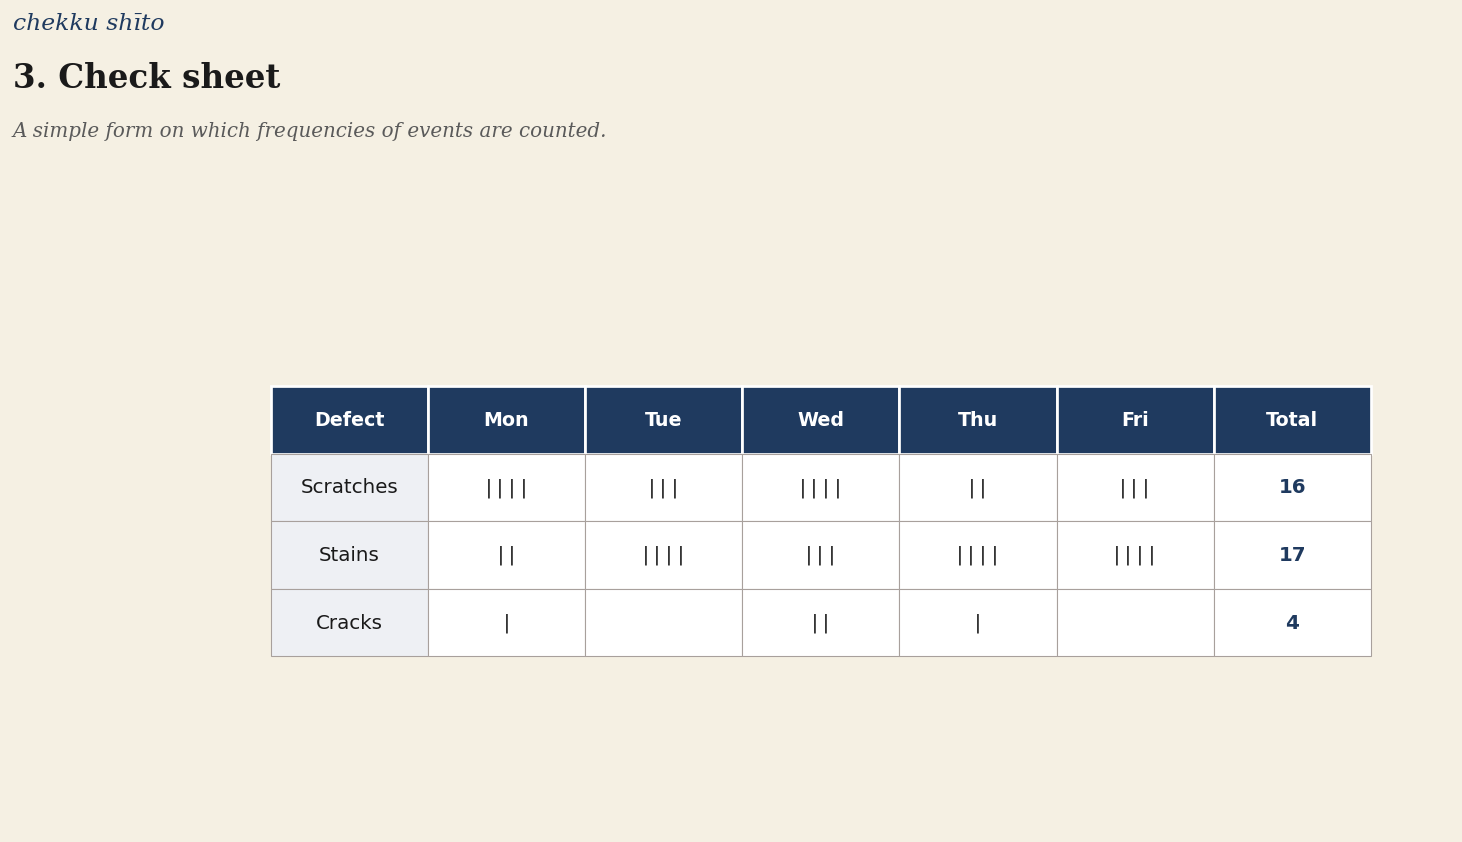
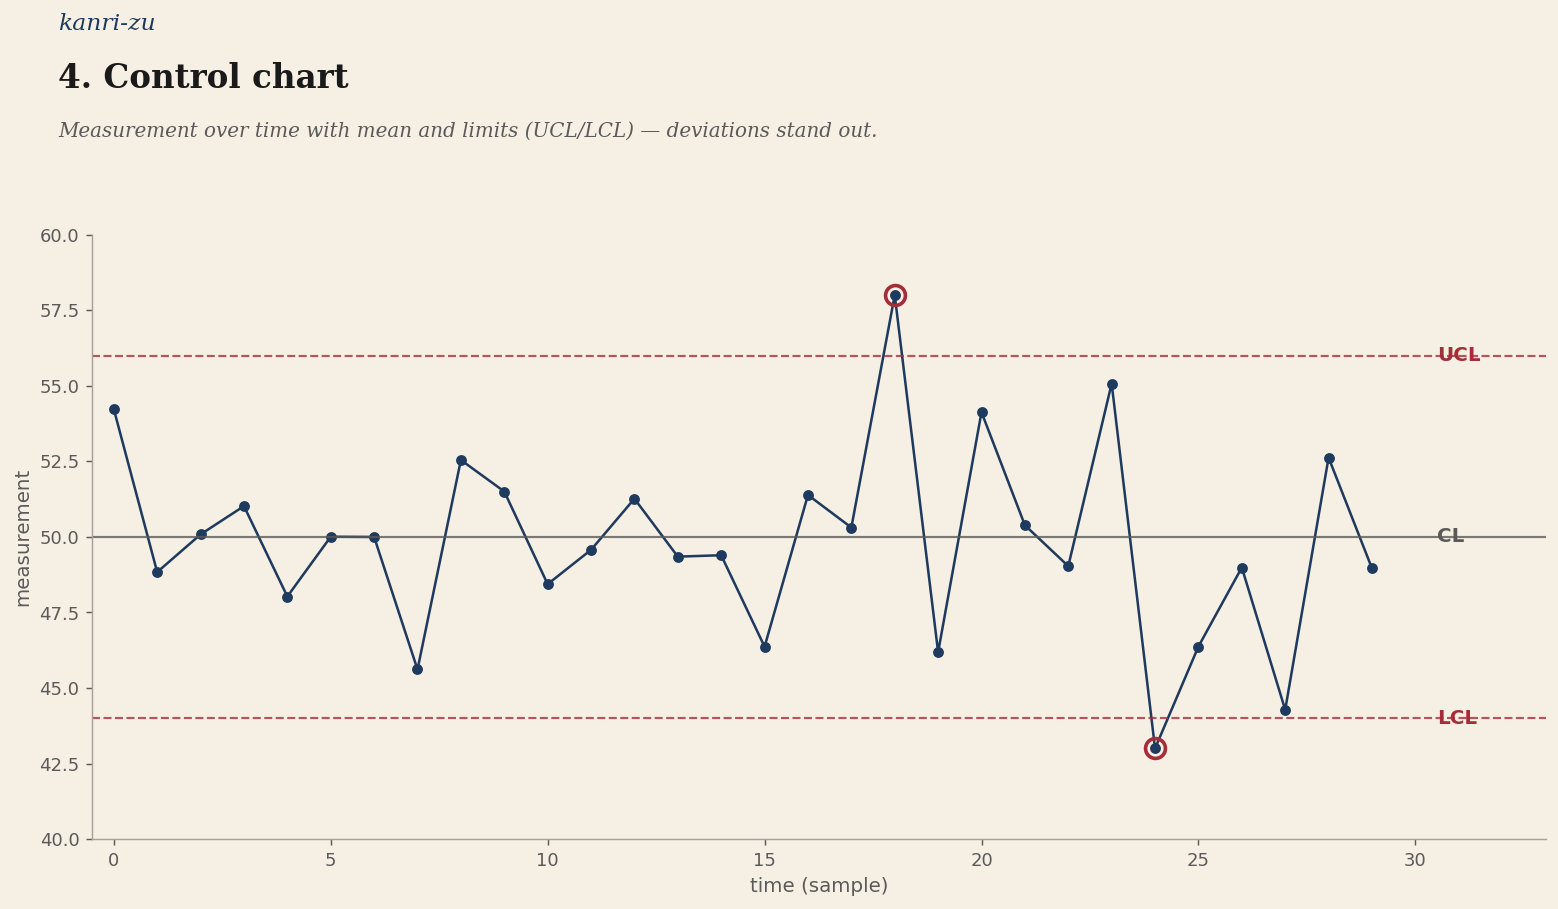
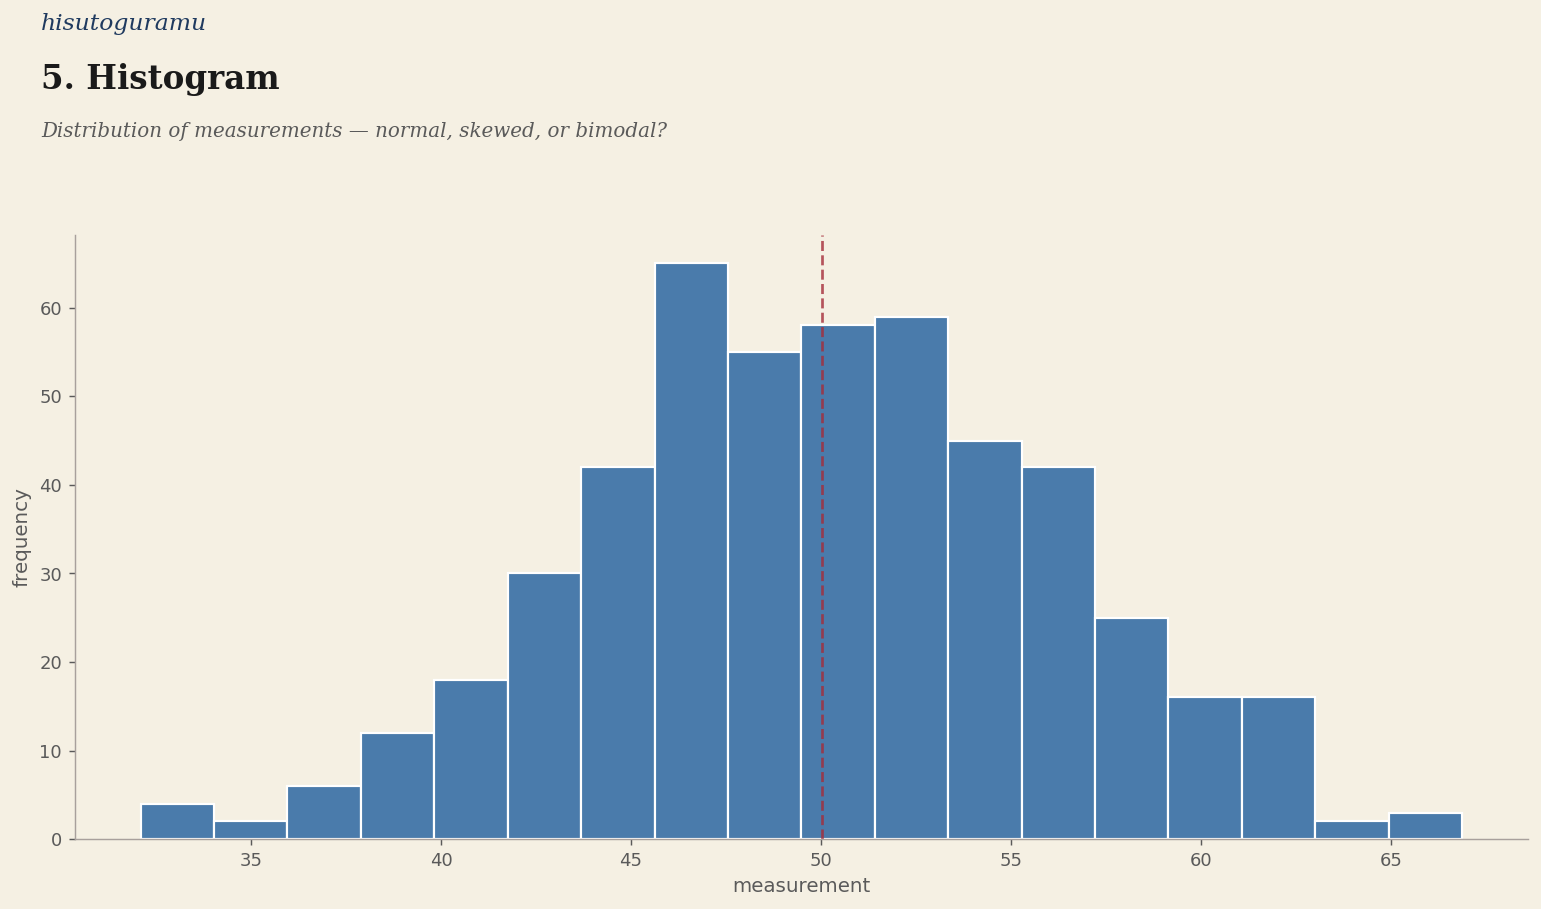
Eight instruments — seven from Ishikawa's package plus the Western order analysis from structural steelwork. Together: a complete diagnostic toolkit applied consistently in this journal to Dutch files.
The Bridge to the Rest
The seven are not for factories. They are for every process in which people make decisions. In the following articles I apply them to three Dutch dossiers where the weight has been systematically ranked incorrectly — methane, nitrogen, and the Dutch understanding of where economic growth comes from. Whoever reads on will have the same tool that a Japanese shop-floor supervisor held in his hands in 1965, and with which his country in thirty years took our second place in the world.
We spent the same thirty years putting those tools aside. There we stand.
Sources: Kaoru Ishikawa, Guide to Quality Control (Asian Productivity Organization, 1968 / 1985); QC七つ道具 — Japanese Wikipedia; Art of Lean — 7 QC Tools (TPS Encyclopedia); Wikipedia, Japanese economic miracle; Yale Centennial Discussion Paper, Japan 1968; Wikipedia, Quality circle; Wikipedia, Economy of South Korea; Braumiller Law Group, Samsung 23% of South Korean GDP, 10 March 2025; Brookings, China's economic growth in retrospect; Wikipedia, Historical GDP of China; CBS/World Bank, NL GDP figures 1990–2024; Walter A. Shewhart, Economic Control of Quality of Manufactured Product (Van Nostrand, 1931).
Before I dissect three Dutch dossiers in this edition, I must first show the instruments I use to do so. They have a name, and that name is not Dutch. It is Japanese, it is old, and it refers to something that is never conveyed with its proper weight in our Western textbooks.
The Seven of Benkei
七つ道具 — nanatsu dōgu — literally means "the seven tools". In the Japanese industrial tradition the phrase refers directly to Kaoru Ishikawa's package of quality instruments, which he developed from 1949 onwards at the Japanese Union of Scientists and Engineers (JUSE). But the phrase is older. It refers to 弁慶の七つ道具 — Benkei no nanatsu dōgu — the seven weapons of Benkei, the legendary warrior monk of the twelfth century who, according to tradition, single-handedly defended the Uji Bridge against three hundred enemies. He possessed seven specific weapons, each with a specific function, and together sufficient to repel every attack — provided their user truly mastered them.
Ishikawa did not simply choose a list of seven at random. He invoked this mythological weight. The seven tools are not a list; they are an oath: seven related instruments, together sufficient to address any quality problem.
What the Package Is
Ishikawa did not invent the seven himself. The Pareto diagram belongs to the Italian Vilfredo Pareto (1906), brought into factory practice in modern form by the Romanian-American Joseph Juran (1951). The control chart belongs to Walter Shewhart (1924) at Bell Labs. The histogram is eighteenth century. What Ishikawa did do was assemble these seven into a single package — simple enough to teach to workers without a university education, and powerful enough to, as he himself wrote, solve ninety-five percent of quality problems on the shop floor.
In 1950 the American statistician W. Edwards Deming travelled to Tokyo, at the invitation of JUSE. In America he had been ignored; the post-war industry of his own country found his method superfluous. Japan listened. Deming donated his royalties to JUSE. With the proceeds the Deming Prize was established — still today Japan's most respected industrial prize. Then came Juran. Then Ishikawa developed the seven and the fishbone. In 1962 the first QC-circles started at the Nippon Wireless and Telegraph Company — voluntary shop-floor groups applying the seven tools to their own work.
In sixteen years that single initiative grew into one million QC-circles with ten million participating workers — nearly a quarter of the Japanese labour force. Ten million workers performing Pareto analyses on their own workplace every week.
It is this package that in thirty years turned a destroyed country into the world's second-largest economy. Here are the figures by country, in today's euros.
Japan
In 1965 Japan's nominal GNP stood at 91 billion dollars. In 1980, fifteen years later, 1,065 billion dollars. A twelvefold increase in fifteen years. Converted and corrected for inflation: from roughly 800 billion euros in today's purchasing power, to nearly 8 trillion euros. Average monthly consumption of urban households doubled between 1955 and 1970. A country that in 1945 had barely escaped hyperinflation had by 1968 become the world's second-largest economy, overtaking West Germany.
In 1989, four years before Deming's death, the American business press admitted what had long been denied: Japanese industry had caught up with American industry in quality and displaced it in market share. The American trade deficit with Japan reached 49 billion dollars that year — in today's purchasing power roughly 110 billion euros, one year, one bilateral relationship. The automotive industry, the electronics industry, the optical industry, the semiconductor industry: all taken over by companies — Toyota, Honda, Sony, Canon, Nikon, Panasonic — that had made the seven tools routine on their shop floor.
Toyota alone has operated the so-called Toyota Production System since the 1960s, which is in essence an extension of Ishikawa's package. Today Toyota is the world's largest carmaker by production volume, with a market value of well over 220 billion euros.
South Korea
Korea began twenty-five years later. In 1962, after the war and under Park Chung-hee's first five-year plan, GNP stood at 2.7 billion dollars — virtually nothing. In 1989, twenty-seven years later, 230 billion dollars. An eighty-fivefold increase. In today's euros a leap from roughly 25 billion to 470 billion euros in three-quarters of a human lifetime.
The chaebols — Samsung, Hyundai, LG, SK, Daewoo — adopted the Japanese model of quality circles almost directly. Samsung had its own Six Sigma programme by the late 1980s, building on Ishikawa's instruments. Hyundai applied fishbone analysis in its welding shops before it exported its first car to Europe. South Korea's GNP today stands at 1,870 billion dollars — nearly 1,730 billion euros.
Samsung alone represents roughly 23 percent of South Korean GNP in 2024 — approximately 400 billion euros. One company, grown from Ishikawa's QC tradition, is nearly equal to a quarter of a national economy. It is the most powerful single piece of evidence that the Japanese method did not work for one country alone, not for one culture, not for one period. It works wherever it is applied.
China
China took the step even more sharply. In 1978, the year Deng Xiaoping introduced the market economy, Chinese GNP stood at roughly 150 billion dollars — less than two percent of the world economy. In 2018, forty years later, 13.6 trillion dollars — eighteen percent of the world economy. A ninetyfold increase in four decades.
Between 1979 and 2008, productivity improvement — what the Japanese called kaizen, building on the seven tools — contributed more than eighty percent of the growth in output per worker. Not investment. Not labour expansion. Not economies of scale. But the targeted improvement of what the shop floor did daily, using instruments that Japan had developed and China had adopted. A country of a billion people lifted itself out of poverty in thirty years, and the primary factor was precisely the instrument that in our own society has been declared superfluous.
The Netherlands — What We Have Lost
A calculation, conservatively performed. Dutch GNP grew between 1990 and 2024 at an average of roughly 1.4 percent per year. Korean GNP grew over the same period at an average of roughly 5 percent per year — less than its peak decades, but still three and a half times our rate. If the Netherlands had grown at half the Korean pace over this period — not the full 5 percent but 2.5 percent — our GNP today would be around 1,700 billion euros instead of the actual 1,150 billion euros.
The difference — 550 billion euros — is what the Netherlands missed in thirty years by ignoring the instruments that were used elsewhere. Per inhabitant roughly 30,000 euros in income that never materialised. Per Dutch family of four: 120,000 euros that was not earned. Not because we lacked the capability. But because we discarded the tools with which others built it.
That is not a moral statement. It is a measurable ratio between those who used the seven tools and those who set them aside.
The Netherlands — Where We Would Stand If We Commit
But pain alone is not analysis. The question that truly matters is: where will we stand in thirty years if we pick up the tools this afternoon? Not as a thought experiment, but as an arithmetical projection based on what has actually been achieved in other countries.
Suppose the Netherlands were to introduce from 2026 onwards a productivity discipline comparable to that of Japan between 1955 and 1985 — not the growth figures of that era, which are no longer attainable for a developed country, but the discipline that caused the growth. A structural productivity improvement of 2.5 to 3 percent per year instead of the current 0.3 to 0.5 percent. That is neither a miracle nor a utopia; it is what Germany still achieves in its manufacturing sectors, what Switzerland has achieved for decades, and what Dutch petrochemistry and water management already achieve in those places where they do work with the method.
Projected over thirty years: a Dutch GNP of around 2,400 billion euros in 2056, instead of a probable 1,400 to 1,500 billion under unchanged policy. A bonus of roughly 900 billion euros relative to the continuation of the current trend. Per inhabitant: approximately 50,000 euros more income per year. Per family of four: 200,000 euros more per year than today.
The question is not whether this is possible. Three peoples have already demonstrated it. The question is only whether we are prepared to muster the discipline they showed. For that no revolution is needed, no new party, no charter, no demonstration. All that is needed is the willingness to add one question to every administrative decision: what is the first-order factor here, and which factors weigh 5× less and therefore do not? Whoever asks that question honestly, at the service counter, in the consulting room, behind the desk of the inspector, in the council chamber and in the editorial office — that person has already picked up the seven tools. They may not even know it themselves.
This is what I hope this edition will bring about. Not that you agree with me. But that when you open the newspaper tomorrow, you ask one more question than you asked yesterday. That one question repeated in ten million hands is what in Japan between 1962 and 1980 generated one trillion dollars in prosperity.
That is what money is, in its most honest form. Money is an unintended consequence of the repeated asking of the right question at the right level by enough people simultaneously.
The Seven, Listed
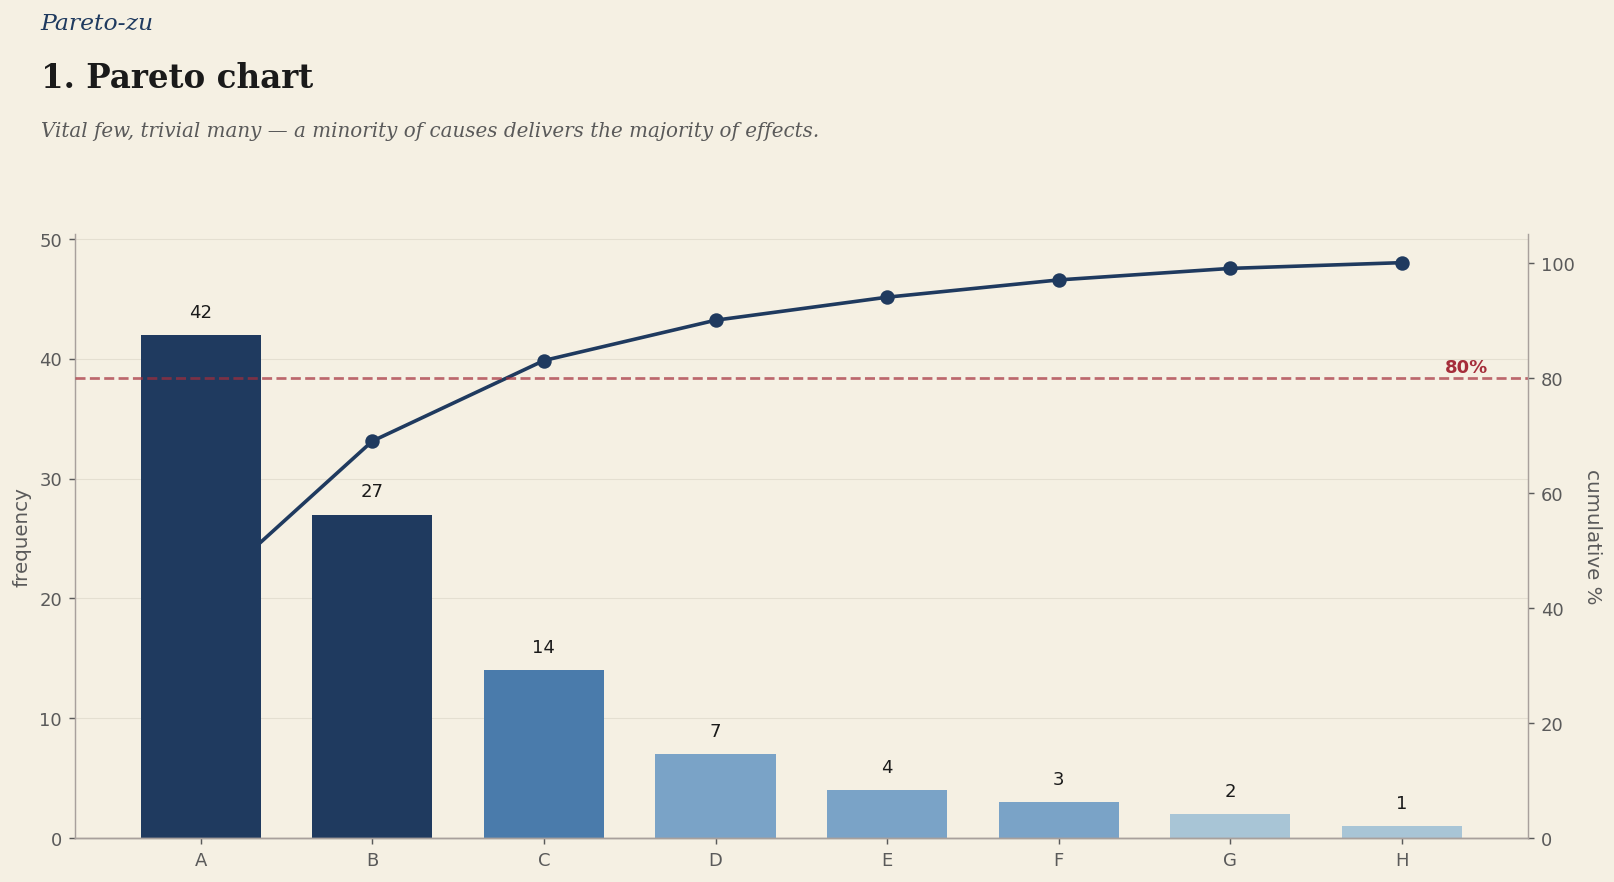
Below are the seven, in the order Ishikawa used in his book. At the bottom an eighth — not the equal of the seven, but a Western parallel I add from my own field, structural steelwork. Each tool has its own detail page; click through on the Japanese name to read the explanation and the Dutch practical example.
Eight instruments — seven from Ishikawa's package plus the Western order analysis from structural steelwork. Together: a complete diagnostic toolkit applied consistently in this journal to Dutch files.
The Bridge to the Rest
The seven are not for factories. They are for every process in which people make decisions. In the following articles I apply them to three Dutch dossiers where the weight has been systematically ranked incorrectly — methane, nitrogen, and the Dutch understanding of where economic growth comes from. Whoever reads on will have the same tool that a Japanese shop-floor supervisor held in his hands in 1965, and with which his country in thirty years took our second place in the world.
We spent the same thirty years putting those tools aside. There we stand.
Sources: Kaoru Ishikawa, Guide to Quality Control (Asian Productivity Organization, 1968 / 1985); QC七つ道具 — Japanese Wikipedia; Art of Lean — 7 QC Tools (TPS Encyclopedia); Wikipedia, Japanese economic miracle; Yale Centennial Discussion Paper, Japan 1968; Wikipedia, Quality circle; Wikipedia, Economy of South Korea; Braumiller Law Group, Samsung 23% of South Korean GDP, 10 March 2025; Brookings, China's economic growth in retrospect; Wikipedia, Historical GDP of China; CBS/World Bank, NL GDP figures 1990–2024; Walter A. Shewhart, Economic Control of Quality of Manufactured Product (Van Nostrand, 1931).