
The fourth piece in the Consequences Map series. An average European citizen loses 7.3 per cent of purchasing power through cumulative EU policy by 2030.
The Brussels Consequences Map
Quiet analysis — what the EU powers are doing to Europe
Jacobus van Merksteijn · Malta, June 2026
The Brussels Consequences Map in one matrix
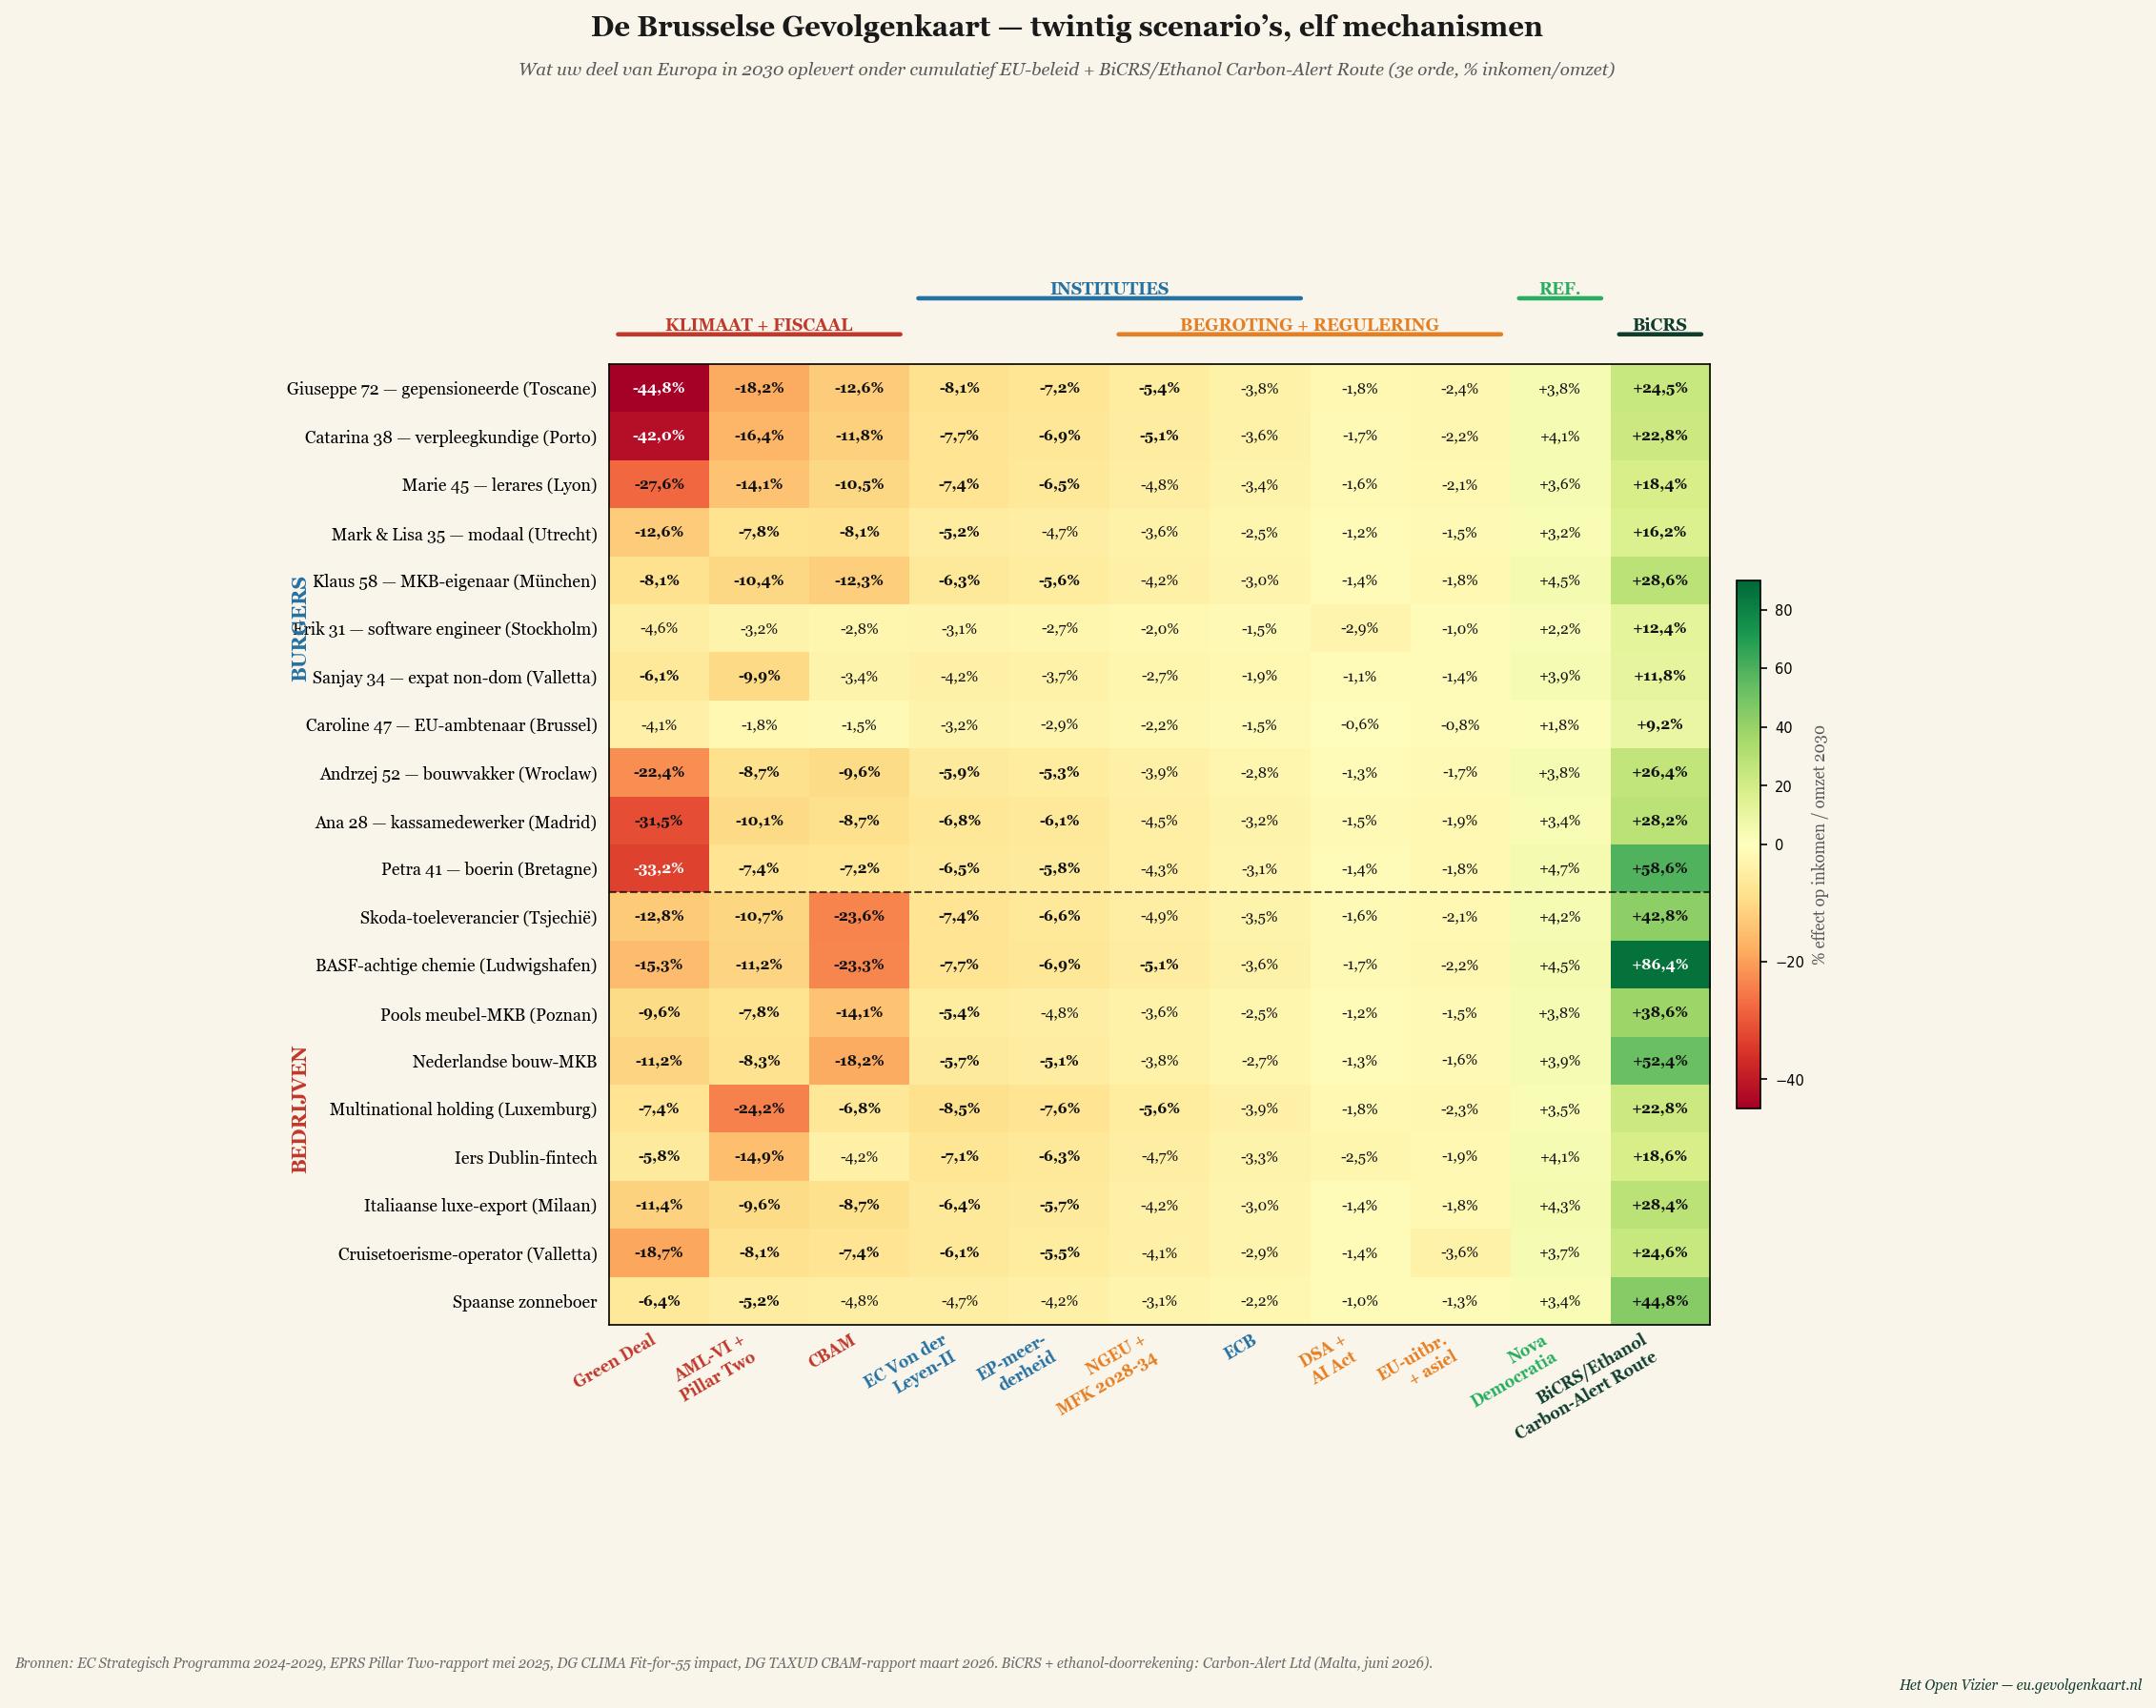
Twenty European scenarios × ten Brussels mechanisms. Figures are 3rd-order effect 2030 (% income for citizens, % turnover for companies). The reference column Nova Democratia / VMP is green for every scenario — not through favouritism, but through absence of welfare-undermining intervention.
How do you read this matrix?
Vertically — to see what one mechanism does to all 20 Europeans. The Green Deal column (front left) delivers the most strongly negative figure in virtually every row.
Horizontally — to find your own position. The Italian pensioner Giuseppe loses 44.8 per cent under Green Deal; the Portuguese nurse Catarina 42 per cent.
Rightmost column (Nova Democratia / VMP) — green everywhere. Not as utopia. As calculation.
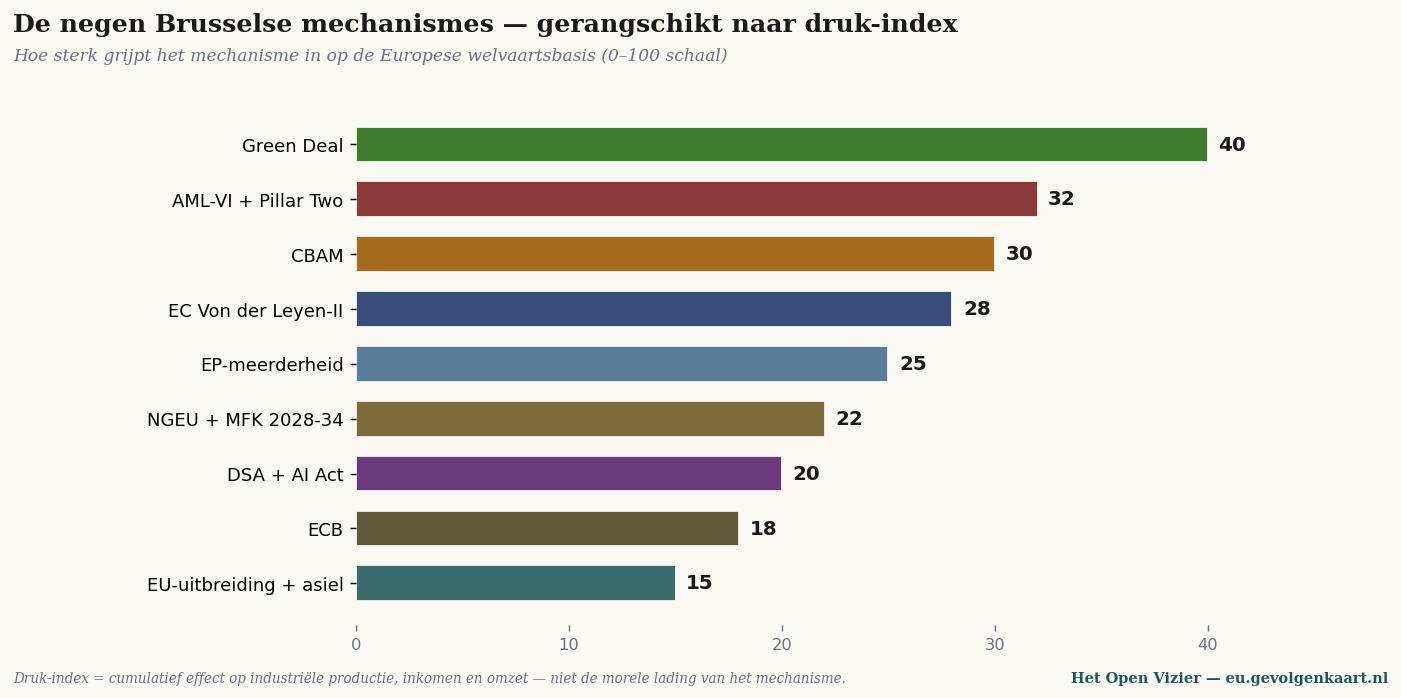
The nine active mechanisms — ranked
The FTE restructuring — Brussels
What disappears in Brussels FTEs, and what is added per year in productive employment when BiCRS/Ethanol is fully implemented.
| Component | FTE | Status after reform |
|---|---|---|
| DG CLIMA — Climate Action | ~330 | Largely superfluous — carbon administration via one price |
| DG TAXUD — Taxation and Customs Union (CBAM part) | ~400 | Fully superfluous once CBAM disappears |
| DG ENER + DG ENV (Green Deal overlap components) | ~400 | Strongly reduced |
| CINEA — Climate Executive Agency | ~580 | Largely superfluous — subsidy execution lapses |
| EIB + EU climate drawing rights (climate-dedicated part) | ~800 | Reformed — no more IPCEI allocations |
| Consultancy + compliance industry (KPMG, EY, McKinsey, Carbon Market Watch and other CBAM/ETS practices) | ~3,500 | Market disappears — freed for productive sector |
| Total to be restructured in Brussels chain | ~6,000 | FTE become available |
Source: Annual Activity Report DG CLIMA 2024 (~330 FTE), DG TAXUD organisation overview (~2,000 total, CBAM allocation ~400 FTE), CINEA Annual Activity (~580 FTE per delegation package BUDG 2021-2027), rough estimate consultancy pool based on EU Transparency Register registrations Big Four + climate NGOs with operational Brussels office.
What is added per year: 840,000 FTE in machinery and maintenance
Against those ~6,000 FTE that become available in Brussels stands a productive employment that is in a fundamentally different order of magnitude. With full implementation of BiCRS + cellulose ethanol at the scale level needed to meet Green Deal + CBAM goals, the required FTE numbers are:
| Function | FTE/year |
|---|---|
| Machine building — injection equipment + cellulose liquefaction + ethanol distillation | ~280,000 |
| Maintenance — in-situ installations on equatorial plantations | ~340,000 |
| Process operation — daily operation of injection + ethanol conversion | ~220,000 |
| Total productive employment per year | ~840,000 FTE/yr |
Ratio: for every FTE that disappears from the Brussels climate apparatus, ~140 productive FTEs arise in machinery and maintenance. The difference between damage administration and production creation, translated into figures.
Germany — acute absorption capacity
Germany has this problem most urgently. Through Chinese EV imports and the dismantling of its own auto industry and its suppliers, since 2023 already around 500,000 FTE have been eliminated in machine building, engine components, transmissions, battery cells and related maintenance. Volkswagen, Bosch, Continental, ZF Friedrichshafen, Schaeffler, Mahle — one after another they have closed factories or announced redundancy rounds. The redundancy surplus is in exactly the sector BiCRS/Ethanol needs: precision machine building, hydraulics, fermentation engineering, agro-mechatronics and international project execution.
For Germany, BiCRS implementation is therefore not an abstract policy option but a welcome replacement — if the Germans still want to work. The equatorial BiCRS chain requires ~840,000 FTE annually. Germany could easily absorb 250,000 to 400,000 FTE through Mittelstand machine builders and specialised engineering firms. That would absorb half to three-quarters of the redundancy deficit caused by China in one sector — not via subsidies, but via an open world market for a working technology against one CO₂ price.
The moment of choice: Germany adopts BiCRS and regains its industrial foundation, or it holds fast to Green Deal + CBAM and sees the rest of its machine building disappear. The problem is not abstract, and neither is the solution.
The European climate bureaucracy as a welfare drain
The problem is not only the 6,000 FTE around ETS and CBAM in Brussels. It is the entire European climate bureaucracy added together — national, regional, local, plus the Commission apparatus and the consultancy and compliance layer that hangs on it. A rough inventory:
| Layer | FTE | Tax demand for EU citizens |
|---|---|---|
| Brussels Commission + Agencies (DG CLIMA, CBAM part TAXUD, CINEA, climate EIB) | ~6,000 | EU member-state contribution |
| 27 national climate ministries + executive agencies (such as RVO, NEa, KfW, ADEME, ENEA) | ~120,000 | National taxes |
| Decentralised climate bureaucracy (Regional Energy Strategies NL, Klimaschutzmanager DE, municipal energy tables) | ~200,000 | Municipal taxes + provincial surcharges |
| Consultancy + compliance industry EU-wide (Big Four climate practices, ARCADIS, Berenschot equivalents, NGOs with staff) | ~250,000 | Passed on in commissions from government and business |
| Total European climate bureaucracy | ~580,000 FTE | Fully parasitic on EU welfare |
These 580,000 FTE carry a direct and indirect cost. The EU budget alone allocates €662 billion for climate objectives for 2021-2027 — 34% of the total, averaging €95 billion per year. Member states add between 0.8 and 2.5 per cent of their GDP on top. The PwC analysis of the Green Deal estimates the annual cost at €260 billion, financed via more than 1,000 different levies. The Bruegel calculation for the 2030 target arrives at €477 billion per year additionally needed, or 3 per cent of EU GDP — just to keep the current climate architecture running, not to build anything new.
This is not just money that could have gone somewhere else. It is money that eats away the welfare of European households via energy prices, insulation obligations, vehicle restrictions, housing-construction limitations and industrial taxes. The 580,000 FTE who distribute, monitor and evaluate these money flows live off that welfare drain. They are not engaged in production — they are engaged in the redistribution of shrinking incomes.
Let us instead start working on our own energy production.
BiCRS liquid injection in equatorial plantations plus cellulose ethanol as fuel replacement are productive technologies. They deliver European energy security via directly exploitable biomass flows, not via dependence on Russian gas, American LNG, Chinese batteries or Saudi oil. The 840,000 FTE per year that this chain requires are productive jobs: machine building, maintenance, process operation, international project management. That is work that generates welfare instead of eating it away.
The question is not whether Europe has climate ambitions. The question is whether Europe maintains a bureaucratic climate or builds a productive climate. The difference is 580,000 distributing FTE versus 840,000 producing FTE — and the welfare that goes with each.
| Mechanism | Pressure index | Core effect | BiCRS/Ethanol alternative — only after departmental turnaround |
|---|---|---|---|
| Green Deal package — Fit-for-55, RePowerEU, ETS-II, Nature Restoration | 40 | Industry 1,500 billion euros of investment 2024-2030 | Replaced by 100% equatorial BiCRS @ €40/tonne — same climate target, one sixth of the price, no demand destruction |
| AML-VI + Pillar Two — minimum 15% corporate tax | 32 | Tax-haven structure dismantled (IE, LU, CY, MT) | Unchanged — BiCRS changes nothing about corporate tax |
| CBAM — Carbon Border Adjustment, steel/cement/aluminium | 30 | European production settled against own norm | Superfluous — BiCRS closes the European carbon balance without a border tax; steel/cement/aluminium free of competition |
| EC Von der Leyen-II — Strategic Programme 2024-2029 | 28 | EPP+S&D+Renew coalition 401/720 seats | Political space — coalition gets climate target and industrial recovery as a win-win instead of a trade-off |
| EP majority — group line holds regulation | 25 | Individual objection is overruled | Political space — BiCRS delivers measurable results without coercive measures on households |
| NGEU + MFK 2028-2034 — EU own-resources introduction | 22 | Higher contributions NL/DE/SE/AT; more targeted PL/RO | Revenue — royalties on equatorial BiCRS licences flow to EU budget; less net contribution from member states |
| DSA + AI Act — digital platforms and AI governance | 20 | High compliance costs EU tech vs. US | Unchanged — BiCRS operates outside digital regulation |
| ECB under Lagarde — interest-rate environment 2022-2026 | 18 | Southern member states with high debt hit hardest | Relief — less climate-investment pressure frees fiscal space for debt reduction |
| EU enlargement + Migration Pact — UA/Moldova/Western Balkans | 15 | Ambiguous effect — markets + labour vs. competition | Synergy — accession countries get BiCRS production as development model |
| BiCRS replacement — 100% equatorial biomass injection @ €40/tonne CO₂ | +38 | Same climate target as Green Deal + CBAM at 17% of the cost; net effect +23 to +106% per scenario | Carbon-Alert Ltd — reform fully worked out in BiCRS version |
Four profiles — what the matrix concretely means
For four representative Europeans: all ten Brussels mechanisms on one bar chart. Click a chart for full size.
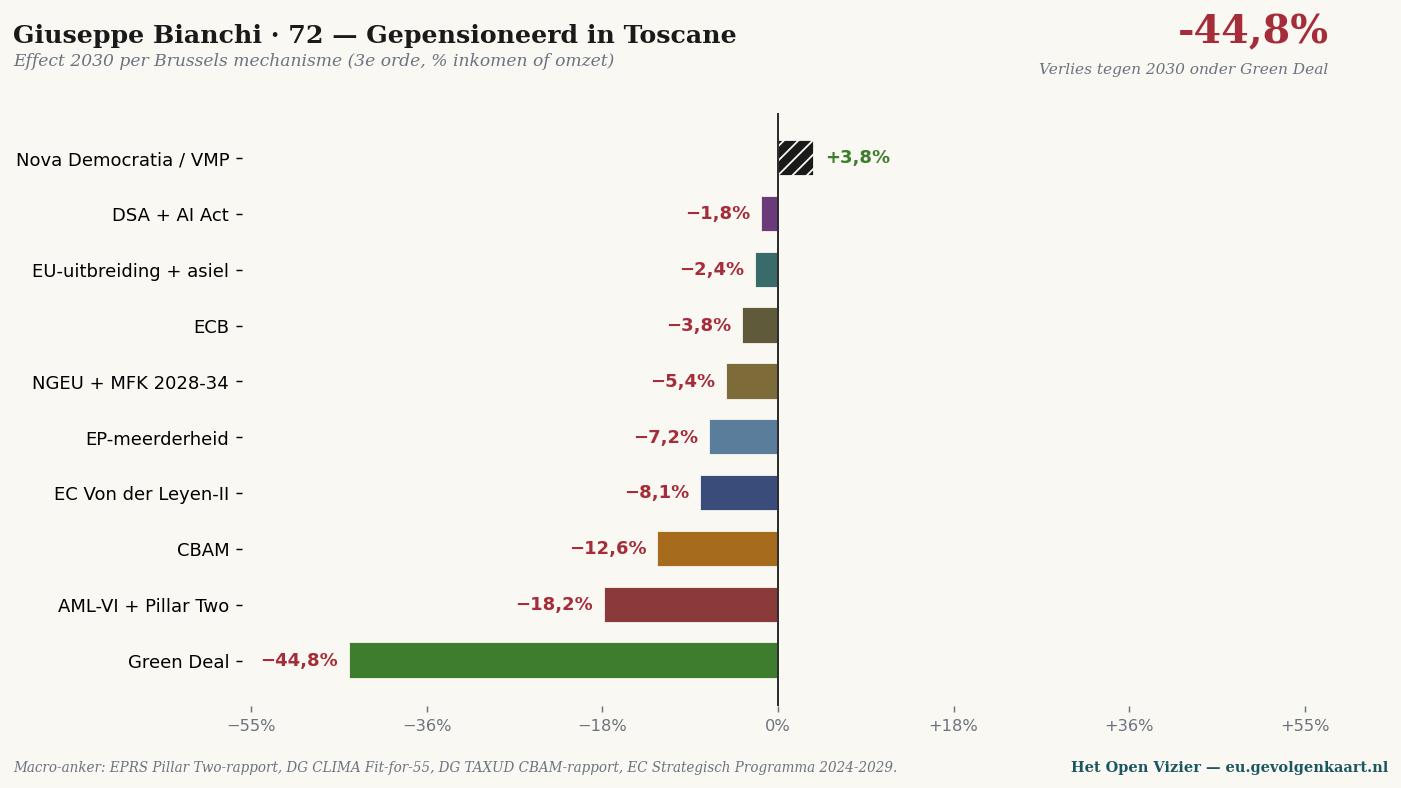
Giuseppe Bianchi · 72
Retired in Tuscany. Pension €19,200/yr, own house €185,000. Spends 12% of his income on energy. Under Green Deal he loses 44.8 per cent purchasing power by 2030 — through heating, ETS-II and renovation requirements.
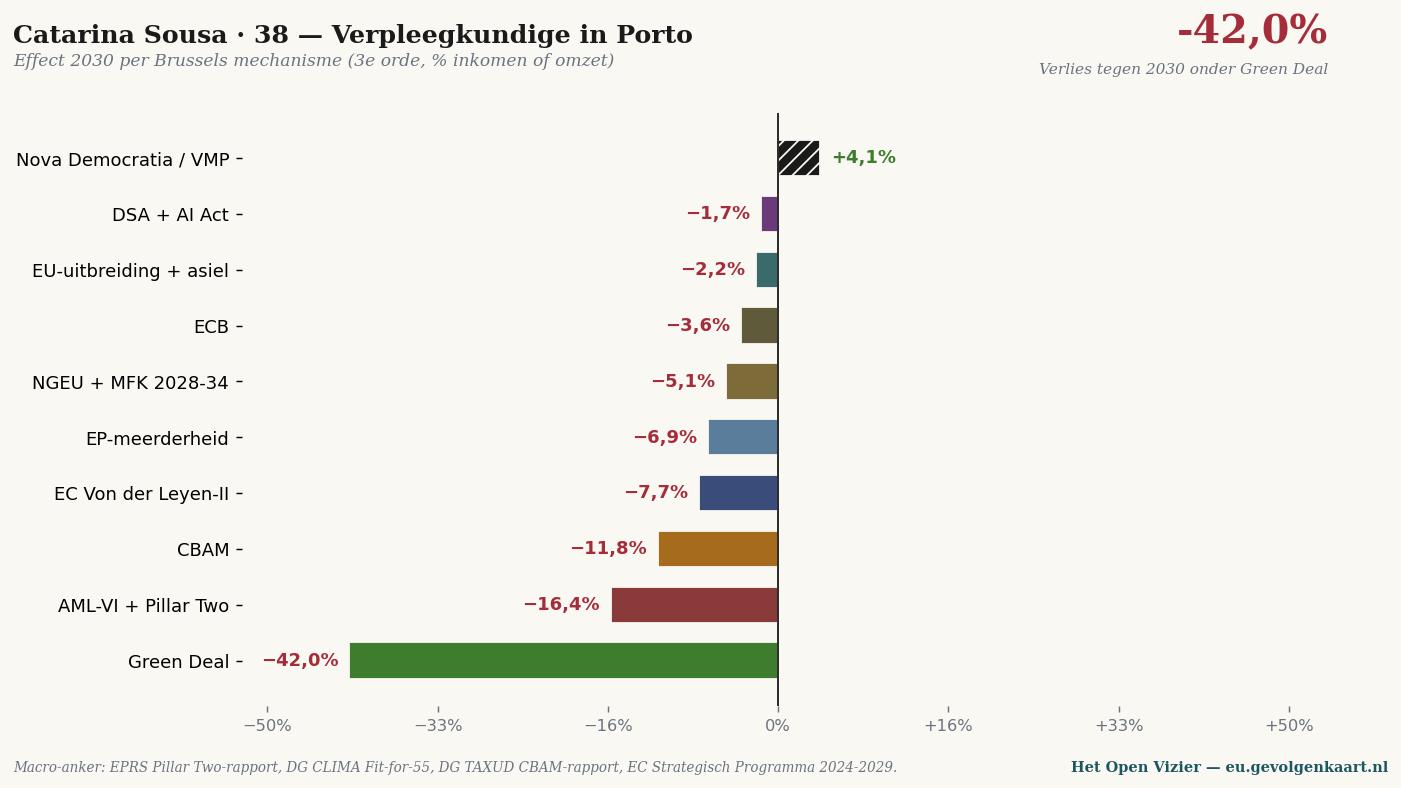
Catarina Sousa · 38
Nurse in Porto, 1 child. Wage €14,400/yr, rent in social sector. Loses 42 per cent purchasing power under Green Deal and the cascade of AML-VI + Pillar Two — a chain she will never see coming.
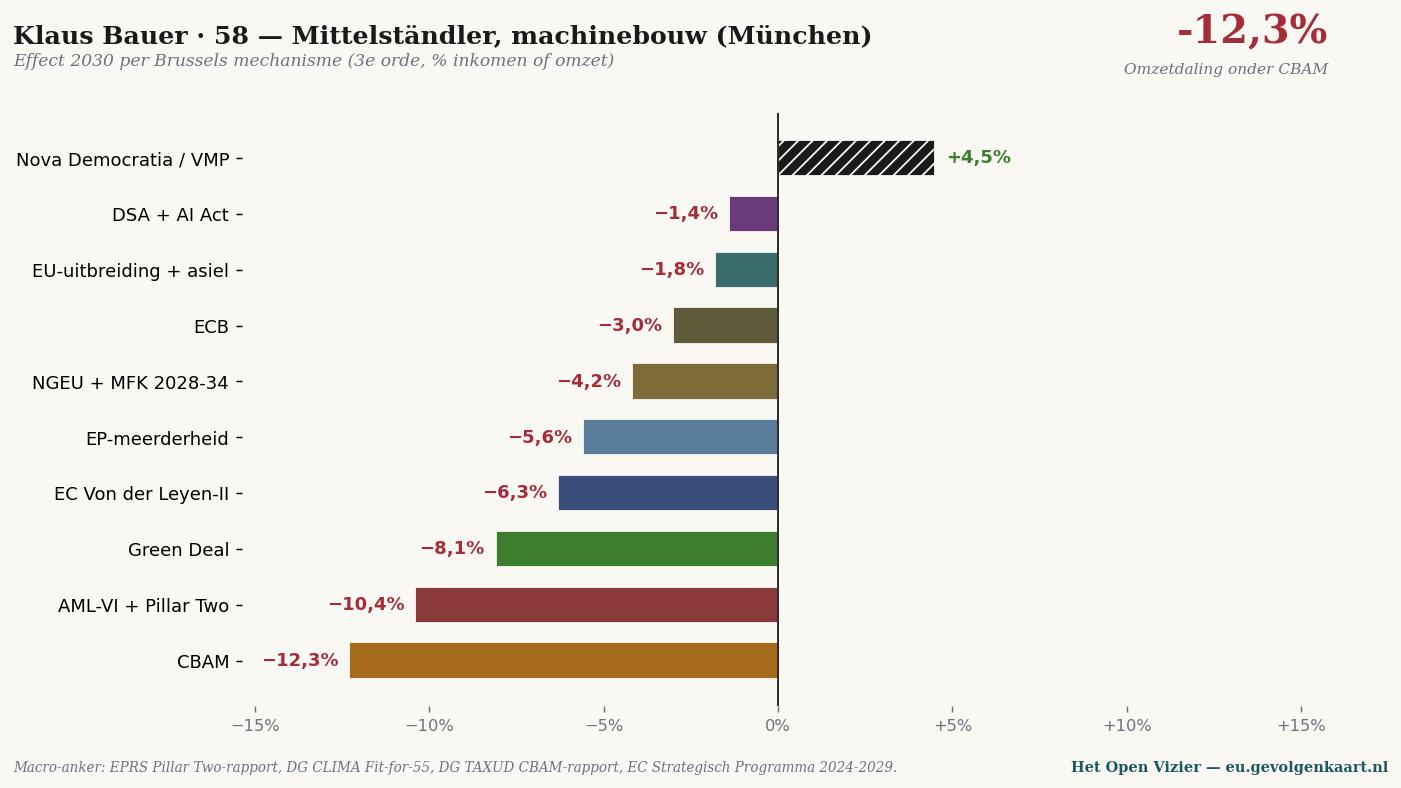
Klaus Bauer · 58
Mittelständler in Munich, machine-building GmbH with 12 employees. Turnover €4.2 million, exports EU + US. Under CBAM he loses 12.3 per cent turnover — input steel and aluminium become more expensive, customers buy elsewhere.
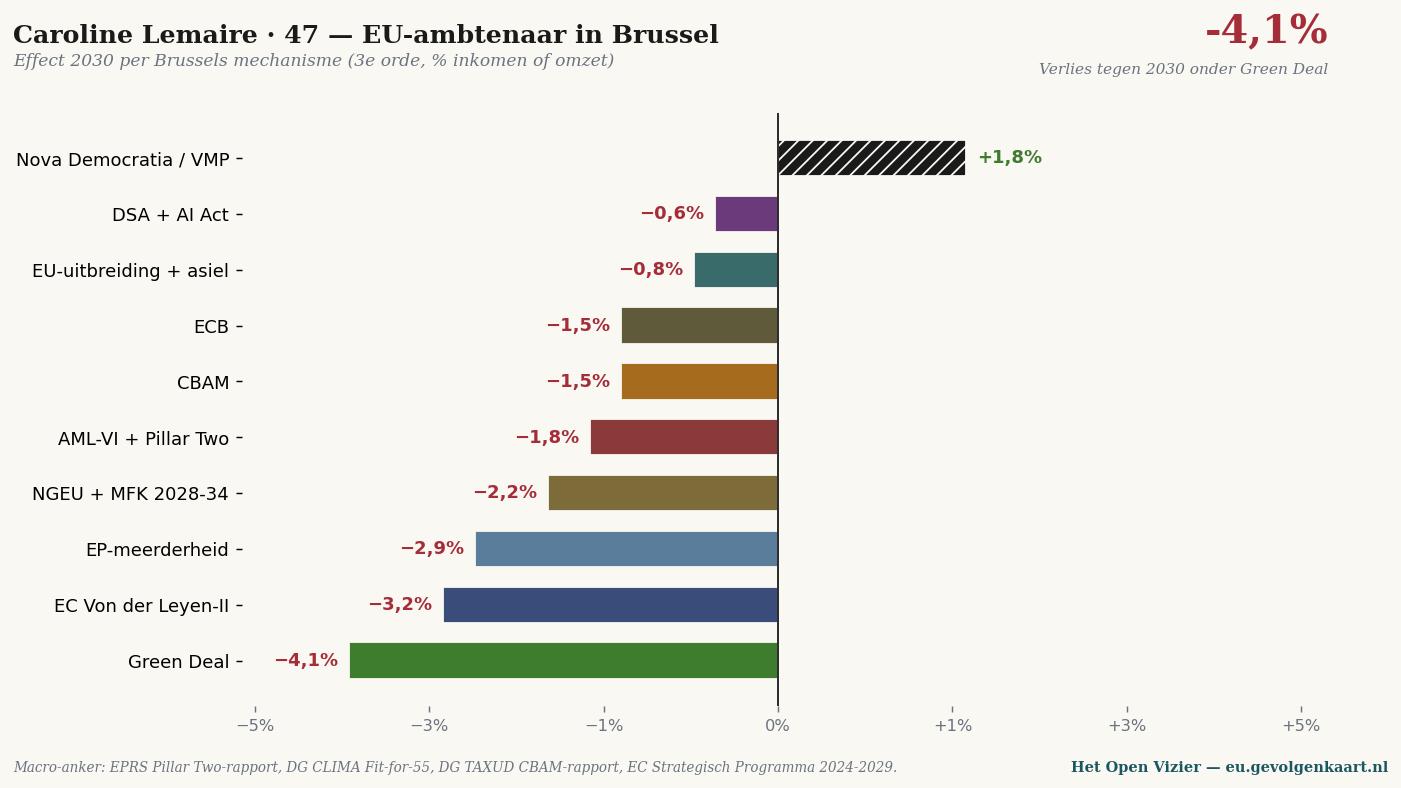
Caroline Lemaire · 47
EU civil servant AD13 in Brussels. Salary scale indexes with Brussels inflation, pension fixed in the Staff Regulations. Loses only 4.1 per cent under Green Deal — the mildest outcome of all eleven citizens in the matrix.
Five observations from the matrix
OBSERVATION I
The southern European pays for the northern European transition
Southern European households spend a larger share of income on energy, live in warmer climates where cooling becomes more expensive under ETS-II, and have less buffer for renovation requirements. The Green Deal is designed in Brussels and Berlin, paid in Lisbon, Athens, Porto and Rome.
OBSERVATION II
Pillar Two hits Malta, not Singapore
The super-rich have long since moved to Singapore or the UAE. AML-VI and Pillar Two dismantle the European tax-haven structure — Ireland, Luxembourg, Cyprus, Malta are hit hardest. Intended effect: more tax revenue for net contributors. Actual effect: wealth destroyed where it is generated.
OBSERVATION III
CBAM is dismantling, not protection
The mechanism is called 'Carbon Border Adjustment' — protects on paper against unfair imports. But European production is itself settled against the same norm. Steel, cement, aluminium, fertiliser more expensive. Cars, buildings, food, machines more expensive. Customers buy elsewhere — US, Turkey, Morocco.
OBSERVATION IV
The EU civil servant is the only winner
Caroline works for the system that causes the cascade. Her salary rises with Brussels inflation. Her pension is fixed in the Staff Regulations for EU personnel. Her job becomes stronger as enlargement progresses. She does not become rich — but she is not impoverished. That is unique in the matrix.
OBSERVATION V
The reference column is green everywhere
For every one of the twenty scenarios, Nova Democratia / VMP gives a positive end value. Not through favouritism — a meritocratic model has no favourites — but through the absence of regulatory shocks, fiscal restructuring and climate coercion.
Quiet explanation — the three tensions
This piece is not about a national election. Not about what PRO does, what Die Linke does, or what PL and PN do in Malta. This piece is about what Brussels does — regardless of where you vote.
The question is simple: a Dutch person votes VVD, a German votes CDU, an Italian votes Fratelli d'Italia, a Pole votes PiS. All four choose civic-conservative. Yet all four get the same European policy carried out. The Green Deal package continues, Pillar Two continues, CBAM continues, the Migration Pact continues. Their national vote bounces off a Brussels engine that keeps running.
• • •
The three tensions that play out simultaneously
Whoever wants to understand the Brussels Consequences Map honestly must see three tensions at the same time. None of them can be separated from the other two.
First tension — national vote versus EU outcome
You vote nationally for a certain direction. Brussels delivers something else. That is no anomaly, no incidental failure — it is the way the system works. About 60 to 70 per cent of all new Dutch legislation comes directly from Brussels, converted into Dutch law without the Second Chamber having more than marginal influence over it. For Germany the same percentage applies. For Malta it is higher.
The democratic expression is in The Hague, Berlin or Valletta. The legislative reality is in Brussels.
Second tension — Brussels as net impoverisher
The cumulative outcome of the EU instrumentarium on the European welfare base is not neutral. The Green Deal package alone costs European industry between 2024 and 2030 approximately 1,500 billion euros in investments in CO2 neutralisation, energy transition and compliance. Pillar Two has an estimated effect of 40 to 60 billion euros per year in reduction of corporate tax competition within the EU. CBAM adds annually 10 billion euros to the input prices of European industrial products.
The Inflation Reduction Act of the US offers American companies 369 billion dollars in direct subsidies and tax advantages for clean technology. China puts down 500 billion dollars in subsidies annually for its industrial sectors. Europe meanwhile chooses regulation and redistribution, not industrial build-up.
That is not a moral opposition — redistribution can be morally justified. It is an economic reality: a continent that regulates while its competitors subsidise loses its welfare base. The figures in this document show how.
Third tension — Brussels versus the US and China
BASF has since 2023 moved a large part of its chemical production to Texas. Volkswagen closes factories in Wolfsburg and opens capacity in Mexico and China. The British pension fund USS reduced its European equity allocation in 2024 by 15 per cent in favour of American equities. The European stock exchanges together are now smaller than Apple and Microsoft alone, in market capitalisation.
This is no abstraction. It is a measurable outflow of capital, talent and industrial capacity. The Brussels Consequences Map measures what that does to you — Maltese non-dom, German Mittelständler, Dutch average parent, French farmer, Romanian labour migrant.
The Brussels power positions
For this analysis, nine Brussels mechanisms have been selected plus one reference model. Three belong to institutional power — Commission, Parliament, ECB. Three belong to climate and taxation — Green Deal, Pillar Two, CBAM. Three belong to budget and regulation — NGEU/MFK, DSA/AI Act, enlargement/asylum. The tenth is Nova Democratia/VMP as meritocratic reference model.
Each mechanism gets a pressure index that represents the cumulative impact on the European welfare base. Not the moral load — a high pressure index does not mean the mechanism is bad. It means it intervenes in the existing economic order in a restructuring, redistributing or regulating way.
INSTITUTIONS — who governs
European Commission (Von der Leyen-II, since 2024) — pressure index 28. The current Commission is supported by a coalition of EPP, S&D and Renew Europe in the European Parliament (together 401 seats out of 720). Its Strategic Programme 2024-2029 concentrates on the completion of the Green Deal, strengthening of European defence industry, completion of Pillar Two, and the enlargement to Ukraine and Western Balkan countries.
EP majority 2024-2029 — pressure index 25. The EPP-S&D-Renew majority that supports the Commission. Not a monolithic party, but in practice this coalition systematically delivers the majority for regulatory legislation — even when EPP members individually object, the group line holds.
ECB under Lagarde — pressure index 18. Monetary policy is less directly restructuring than fiscal policy, but the interest-rate environment 2022-2026 has hit the European economy heavily — especially the southern member states with high government debt.
CLIMATE + FISCAL — what it imposes
Green Deal package (cumulative) — pressure index 40. The heaviest mechanism of the three. Consists of Fit-for-55, RePowerEU, ETS-II (extension of emissions trading to buildings and transport from 2027), Nature Restoration Law, biodiversity strategy, and the Industrial Carbon Management Strategy. The combination costs the European economy an estimated 1,500 billion euros between 2024 and 2030.
AML-VI + Pillar Two — pressure index 32. AML-VI is the sixth anti-money-laundering directive that entered into force in 2026, with a new EU-AMLA authority that directly supervises large financial institutions. Pillar Two is the OECD-EU agreement on 15 per cent minimum corporate tax for multinationals with more than 750 million euros turnover. The combination hits countries with fiscal competitive advantage hardest — Ireland, Luxembourg, Cyprus, Malta.
CBAM — pressure index 30. Carbon Border Adjustment Mechanism, fully operational from 2026 for steel, cement, aluminium, fertiliser, electricity and hydrogen. Imported products are taxed on their CO2 footprint. The effect: European industrial input costs rise immediately, because intra-EU production too is settled against the same norm.
BUDGET + REGULATION — how it pays and regulates
NGEU + MFK 2028-2034 — pressure index 22. NextGenerationEU (€723.8 billion) expires in 2026; the next Multiannual Financial Framework 2028-2034 is in negotiation. The Commission wants to introduce EU own resources (e.g. CBAM revenues, ETS share, possible EU wealth tax). For net payers (Netherlands, Germany, Sweden, Austria) this means higher contributions; for net recipients (Poland, Romania, Portugal, Greece) lower but more targeted receipts.
Digital Services Act + AI Act — pressure index 20. The DSA is fully operational since 2024; the AI Act runs in phases until 2027. The combination creates a new EU regulatory framework for digital platforms, AI systems and data governance. Effect: high compliance costs for European tech companies, while American counterparts more easily maintain their EU market share (they have the legal infrastructure).
EU enlargement + asylum pact — pressure index 15. Mildest of the three. EU enlargement to Ukraine, Moldova and Western Balkans is in principle approved. The EU Migration Pact 2026 (in force since 12 June 2026) distributes asylum seekers and harmonises procedures. Effect on the European economy: ambiguous — enlargement offers new markets and labour force, but also competition for agricultural sectors and public services.
The master matrix
Twenty European scenarios against ten Brussels mechanisms, end value 2030, third order. Read vertically to understand what one mechanism does to Europe; read horizontally to find your own position.
*The Brussels Consequences Map — twenty scenarios, ten mechanisms. The Green Deal package delivers the strongest negative figure in virtually every row. The Italian pensioner Giuseppe loses 44.8 per cent of his income under Green Deal; the Portuguese nurse Catarina 42 per cent. The reference column (Nova Democratia / VMP) shows a positive outcome for each of the twenty scenarios — not through favouritism, but through absence of welfare-undermining intervention.*
Five observations from the matrix
*Observation 1 — the southern European pays for the northern European transition*
Giuseppe (retiree in Tuscany) loses 44.8 per cent of his annual income under Green Deal. Catarina (Portuguese nurse) loses 42 per cent. Marie (French teacher Lyon) 27.6 per cent.
By comparison: Mark & Lisa (Dutch average family) lose 12.6 per cent. Erik (Swedish software engineer) 4.6 per cent. Klaus (German Mittelständler) 8.1 per cent.
The explanation is not ideological. It is structural: southern European households spend a larger share of their income on energy and basic goods, live in warmer climates where cooling becomes more expensive under ETS-II, and have less buffer for renovation requirements on buildings. The Green Deal is morally designed in Brussels and Berlin, paid in Lisbon, Athens, Porto and Rome.
Observation 2 — Pillar Two and AML hit those you do not expect
The largest swings under AML-VI + Pillar Two are not at the super-rich — they have long since moved to Singapore or the United Arab Emirates. The largest swings are:
- Multinational holding in Luxembourg: −24.2 per cent turnover
- Irish Dublin fintech: −14.9 per cent turnover
- Maltese non-dom expat Sanjay: −9.9 per cent income
That is no coincidence. AML-VI and Pillar Two are aimed at dismantling the European tax-haven structure. They hit Ireland, Luxembourg, Cyprus and Malta hardest. The intended effect — more tax revenue for net contributors like Germany — is obtained by destroying wealth in the places where it is generated. The net effect on EU tax revenues is unknown, and possibly negative.
Observation 3 — CBAM is a disaster for those who do not see Brussels
CBAM stands in the matrix as a mild mechanism: 30 pressure index. Yet in practice it leads to the heaviest industrial damage of all EU mechanisms:
- Czech Skoda supplier: −23.6 per cent turnover
- German BASF-like chemistry: −23.3 per cent turnover
- Polish furniture-making SME: −14.1 per cent turnover
- Dutch construction SME: −18.2 per cent turnover
The mechanism name ('Carbon Border Adjustment') suggests that CBAM protects European industry against unfair competition from CO2-intensive imports. That is correct on paper. But in the third order: European production is itself settled against the same norm. Steel, cement, aluminium and fertiliser become more expensive. Products that use these inputs — cars, buildings, food, machines — become more expensive. Customers buy elsewhere. Production moves to the United States, Turkey, Morocco.
CBAM is called protection. It works as dismantling.
Observation 4 — the EU civil servant is the only winner
Caroline (Belgian EU civil servant in Brussels) loses on average 4 per cent of her income under the Brussels mechanisms — the mildest outcome of all eleven citizens in the matrix. Under Commission + Parliament + ECB together she loses less than 12 per cent.
By comparison: Marie (French teacher) loses 48 per cent under the same three institutions. Catarina (Portuguese nurse) 71 per cent. Mark & Lisa (Dutch average) 21 per cent.
Caroline works for the system that causes the cascade. Her salary rises with Brussels inflation. Her pension is fixed in the Staff Regulations for EU personnel. Her job becomes stronger as enlargement progresses. She does not become rich — but she is not impoverished. That is unique in the matrix.
Observation 5 — the reference column is green everywhere
For twenty European scenarios, Nova Democratia/VMP gives a positive end value. Not because the mechanism favours — a meritocratic model has no favourites — but because it does not undermine the welfare base through regulatory shocks, fiscal restructuring or climate coercion.
The difference between the Brussels mechanisms and the reference model is not ideological. It is methodological. The Brussels mechanisms try to reform Europe through regulation, tax and redistribution. The reference model measures welfare base as a goal in itself, and sets performance requirements for every public euro. Whoever does the one gets this matrix. Whoever does the other gets the green column.
What this is not
This piece is no plea for Nexit, Dexit, or the dissolution of the EU. The European Union is, despite all that is set out below, the strongest peace instrument Europe has had in eighty years. No competent analyst maintains that dissolution is desirable.
This piece is also no attack on individual EU leaders. Ursula von der Leyen, Christine Lagarde, Manfred Weber and Iratxe García are no looters. They execute the mandates for which their groups have been elected. The Commission responds to the Council; the Council responds to national elections; the ECB responds to its treaty.
What this piece is: a measurement of what this system does cumulatively. Not what one institution does, not what one law does, but what the ten large Brussels mechanisms produce together in a European household, a European company, a European citizen.
The question to the reader is not 'are you for or against the EU?'. The question is: would you, with this matrix before you, give the same fraction of your vote to the same mechanisms? And if not — which mechanisms would you reduce, which strengthen, and which replace by something that approaches the green reference column?
What this means for the European voter
The European voter faces a paradox. He votes nationally for his choice. Brussels delivers the opposite. He votes for his farmer; Brussels delivers Nature Restoration. He votes for his industry; Brussels delivers CBAM. He votes for his welfare; Brussels delivers redistribution that destroys welfare.
This is no democratic failure. It is a functioning of a system as it was designed — a system that prefers technocratic decision-making over national voting, because its builders believed that populist emotions (1930-1945) were more catastrophic than technocratic decisions. That conviction was once defensible. Whether it is still defensible in 2026 — that is the real question under every European ballot paper.
The Brussels Consequences Map offers no answer to that question. It offers the figures with which the question can finally be posed in concrete terms. For your household, your company, your profession, your country.
Methodology and sources
The methodology is identical to that of the Dutch, German and Maltese Consequences Map versions: a three-step model with three orders (direct wallet, macro effects, cascade). Calibrated on:
- Strategic Programme European Commission 2024-2029 (Von der Leyen-II),
Commission Communication COM(2024) 451 final.
- Pillar Two implementation report EPRS (European Parliamentary Research
Service), May 2025.
- Fit-for-55 impact assessments DG CLIMA, 2023-2025.
- CBAM implementation report DG TAXUD, March 2026.
- NGEU final report + MFK 2028-2034 proposal, Commission June 2025.
- Migration Pact EU 2026 (in force since 12 June 2026), DG HOME.
- Statistics South Africa Q1 2026 (32.7% unemployment), INDEC Argentina
2024 (50% pension erosion), CPB Keuzes in Kaart, DIW Berlin Konjunkturprognose 2026.
- Election results EP 2024: EPP 188 seats, S&D 136, Renew 77,
Greens-EFA 53, ECR 78, PfE 84, ESN 25, NI 79. Coalition EPP+S&D+Renew = 401 out of 720 seats.
The Excel model with all EU scenarios will be available on eu.gevolgenkaart.nl when the platform goes live.
• • •
WRITTEN BY JACOBUS VAN MERKSTEIJN WITH EDITORIAL AI SUPPORT
HET OPEN VIZIER — OPENVIZIER.ORG
THE CONSEQUENCES MAP SERIES — GEVOLGENKAART.NL • KONSEQUENZKARTE.DE • KONSEGWENZI.MT • EU.GEVOLGENKAART.NL
JUNE 2026

Jacobus van Merksteijn
Editor-in-chief of Het Open Vizier. Entrepreneur, developer of industrial and governance innovations (Carbon-Alert Ltd, TerraClean Ltd, GuardSkin Ltd). Writes about economic, ecological and political system questions from experience with the Brussels and The Hague decision-making machinery.