The nature-adapted analysis
What happens to the Dutch cascade when two equatorial biomass tracks replace Brussels climate policy — and how hydrogen relates to both
By Jacobus van Merksteijn · Malta, June 2026
This piece is not an attack. Not a call to action. Not an attempt to persuade you.
It places three technological tracks on the table and calculates what they do to the Dutch cascade. BiCRS (a product of Carbon-Alert Ltd) and ethanol as equatorial alternatives, hydrogen as the reference track from the official climate plans.
Silent Analysis III showed what six Dutch scenarios lose under the current Brussels course. This piece shows what those same six scenarios get back when Brussels chooses a different course. What you do with that is your business.
Three tracks, three analyses
BiCRS — biomass injection beneath the roots of the crop that produced it — permanently removes carbon from the atmosphere. It is the replacement for the Green Deal and CBAM. Production in the equatorial belt, cost price €22–28 per tonne CO₂, model price €40 per tonne.
Ethanol — fermentation of a different equatorial biomass fraction into liquid fuel — replaces natural gas, petrol, diesel, and electricity consumption. Production in large on-site factories in the partner country, shipped to European ports. Production costs €0.20–0.30 per litre, pump price (excise-light) €0.55–0.75/litre. Applied in a micro-CHP — a combined heat and power unit that simultaneously produces heat and electricity — the ethanol track delivers not only the heat for the home but also 170 to 260 percent of its own electricity consumption, with the surplus fed back to the grid.
Both tracks are equatorial because the plant that yields these outputs only grows above 6 degrees Celsius. Both tracks operate independently: a hectare is either a BiCRS hectare with in-situ injection, or an ethanol hectare with transport to a factory. What they share: the same partner countries, the same geopolitical logic, the same beyond-Brussels climate philosophy.
This piece addresses three tracks separately. First the cascade impact of BiCRS implementation. Then the direct wallet impact of the ethanol transition. Finally — as a reference — the calculation of the hydrogen track that features prominently in the current Dutch climate plans. We do not add them into a single figure — they are three independent trajectories each standing on their own.
First analysis — BiCRS impact on the cascade
"The party you elect damages you to precisely the height of its pressure index — unless Brussels chooses a different climate policy."
— the implicit logic of the cascade
Silent Analysis III calculated the third-order cascade for six Dutch scenarios under nine parties plus a meritocratic reference model. The outcome was confronting: PRO/GroenLinks-PvdA produced deeply negative figures for virtually every scenario, not through direct levying but via the cascade that its pressure index sets in motion.
BiCRS implementation changes that cascade dynamic. Not by changing the party programmes — those remain what they are — but by removing the heaviest climate costs from the cascade. The Green Deal and CBAM together represent approximately forty percent of the Dutch climate burden in 2030. When they are replaced by BiCRS @ €40/tonne, that burden falls away and the freed space flows back to households and businesses.
The effect is party-independent. Whichever coalition governs: BiCRS implementation gives every scenario something back. But the effect differs per party in magnitude — parties with a high pressure index cause more cascade damage, and BiCRS benefit therefore compensates more of it.
The landslide in one image
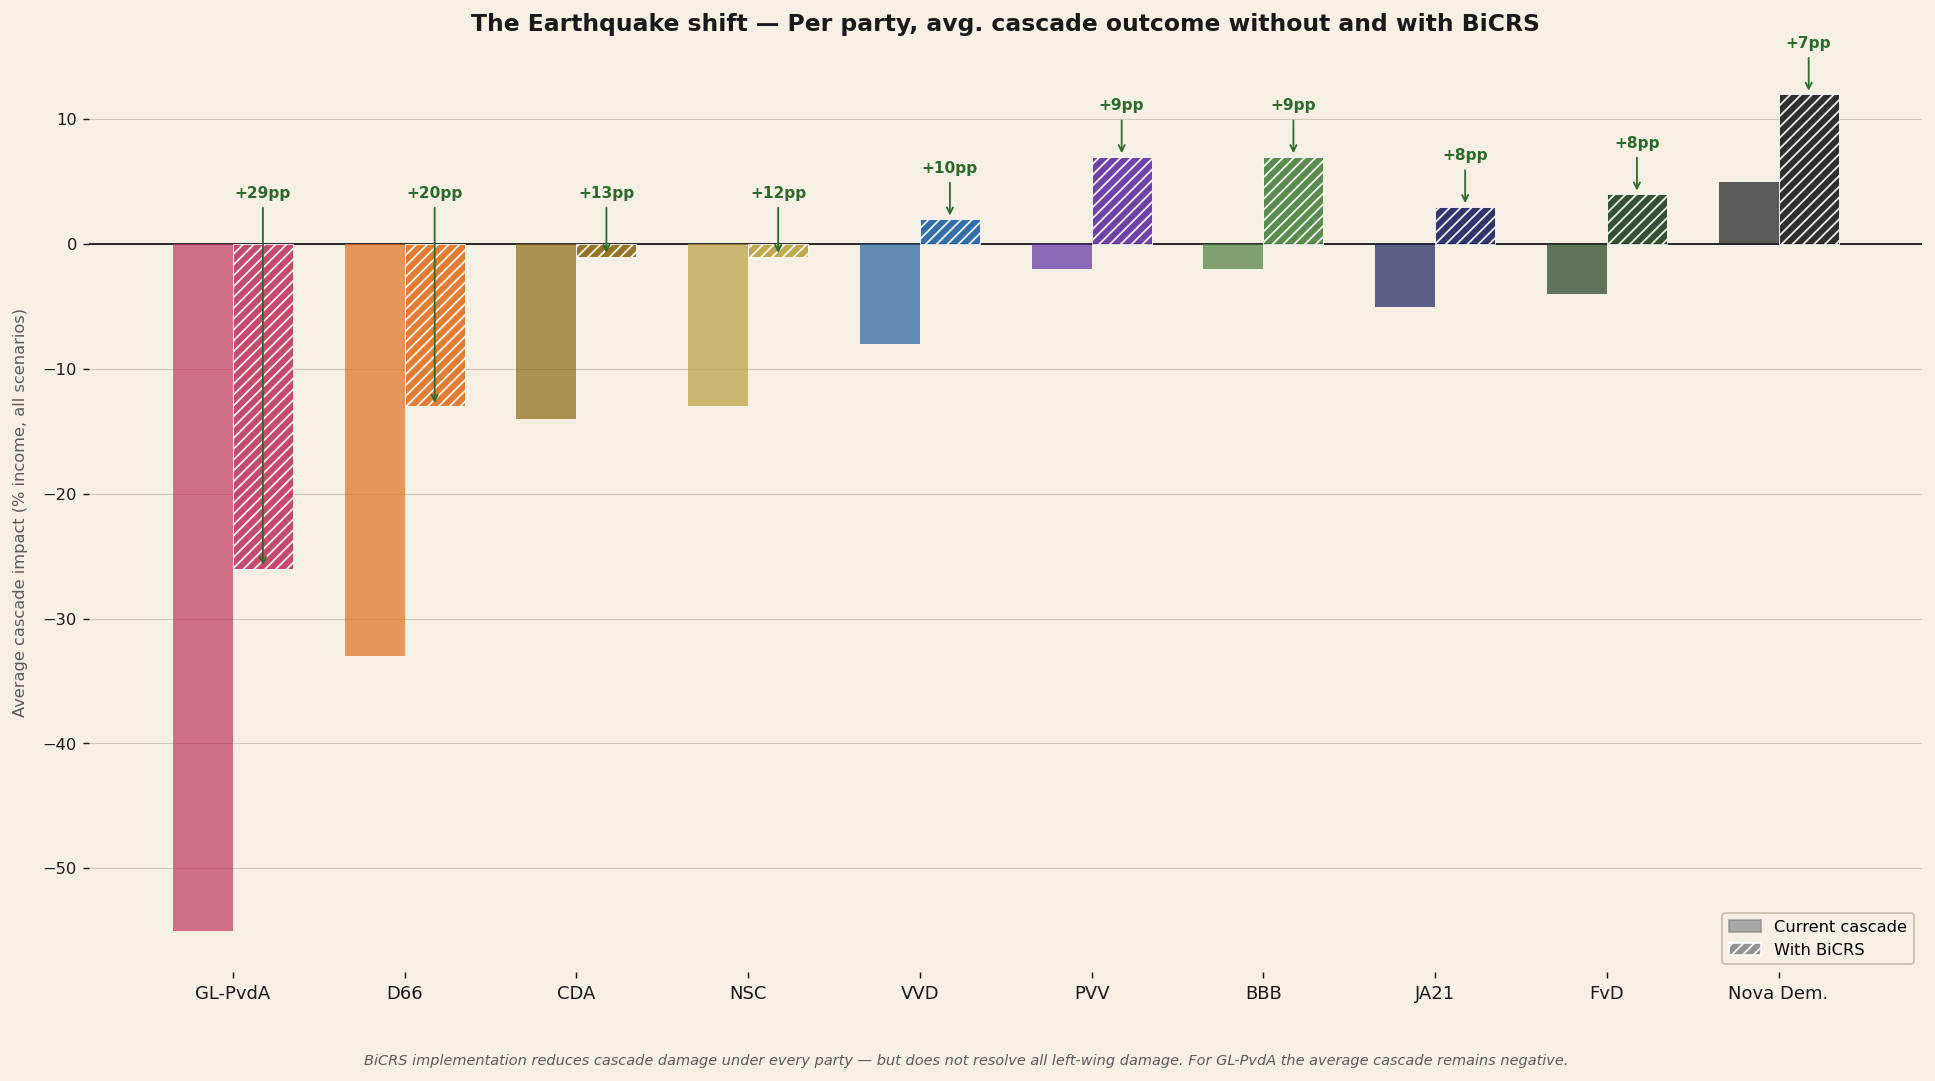
Three observations from this chart:
One — BiCRS implementation compensates the most for parties with the highest pressure index. GL-PvdA improves from an average of −56% to −27%. D66 improves from −35% to −15%. This is no coincidence; parties with a high pressure index cause more climate damage, and BiCRS removes precisely that damage.
Two — for GL-PvdA the average cascade outcome remains negative, even with BiCRS. The landslide is large, but not large enough to neutralise the full left-wing cascade. Wealth tax, box 2 levy, and capital flight effects are not addressed by BiCRS — only the climate component disappears. What remains is the structural damage that every ideology inflicts that penalises the productive base.
Three — under VVD, PVV, BBB, JA21, and FvD the average cascade under BiCRS becomes positive. What under the current Brussels course still caused slight damage tips toward slight gain. For the PVV voter this means not only a different climate policy — it means a coalition that is no longer factually harmful to the average household wallet.
The Dutch matrix — six scenarios, ten parties, BiCRS difference column
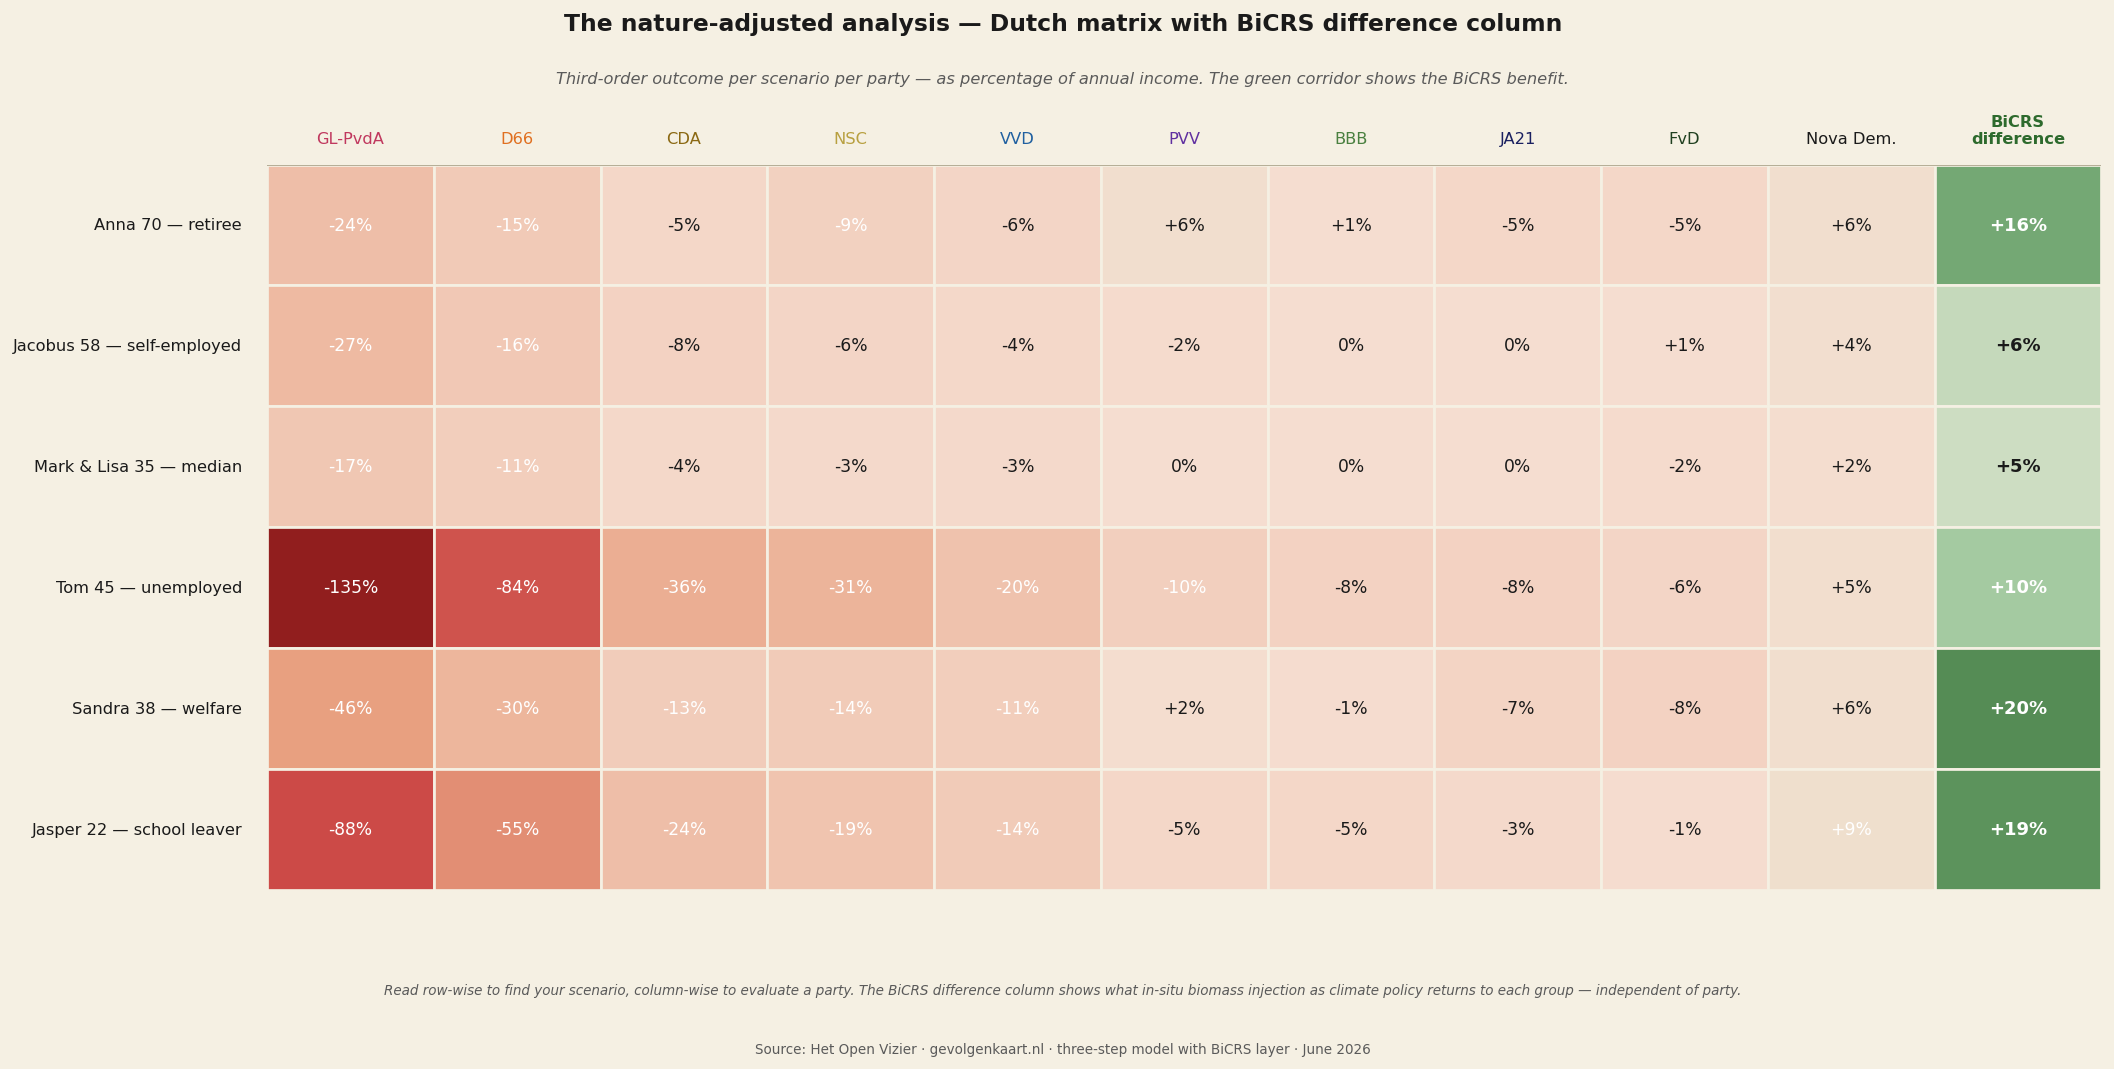
The BiCRS difference column is consistently green — for each of the six scenarios. The magnitude varies from five percent (Mark & Lisa, median household) to twenty percent (Sandra, social assistance). The greatest relative benefit goes to those with the lowest income, because the absolute climate cost made up a larger share of their budget.
For those who have read Silent Analysis III: you will recognise the figures in the left-hand columns — the same deep red numbers under GL-PvdA and D66, the same lighter damage pictures under the centre parties, the same green Nova Democratia column on the right. The BiCRS column is new, and it changes the whole picture.
Per scenario — six stories with figures
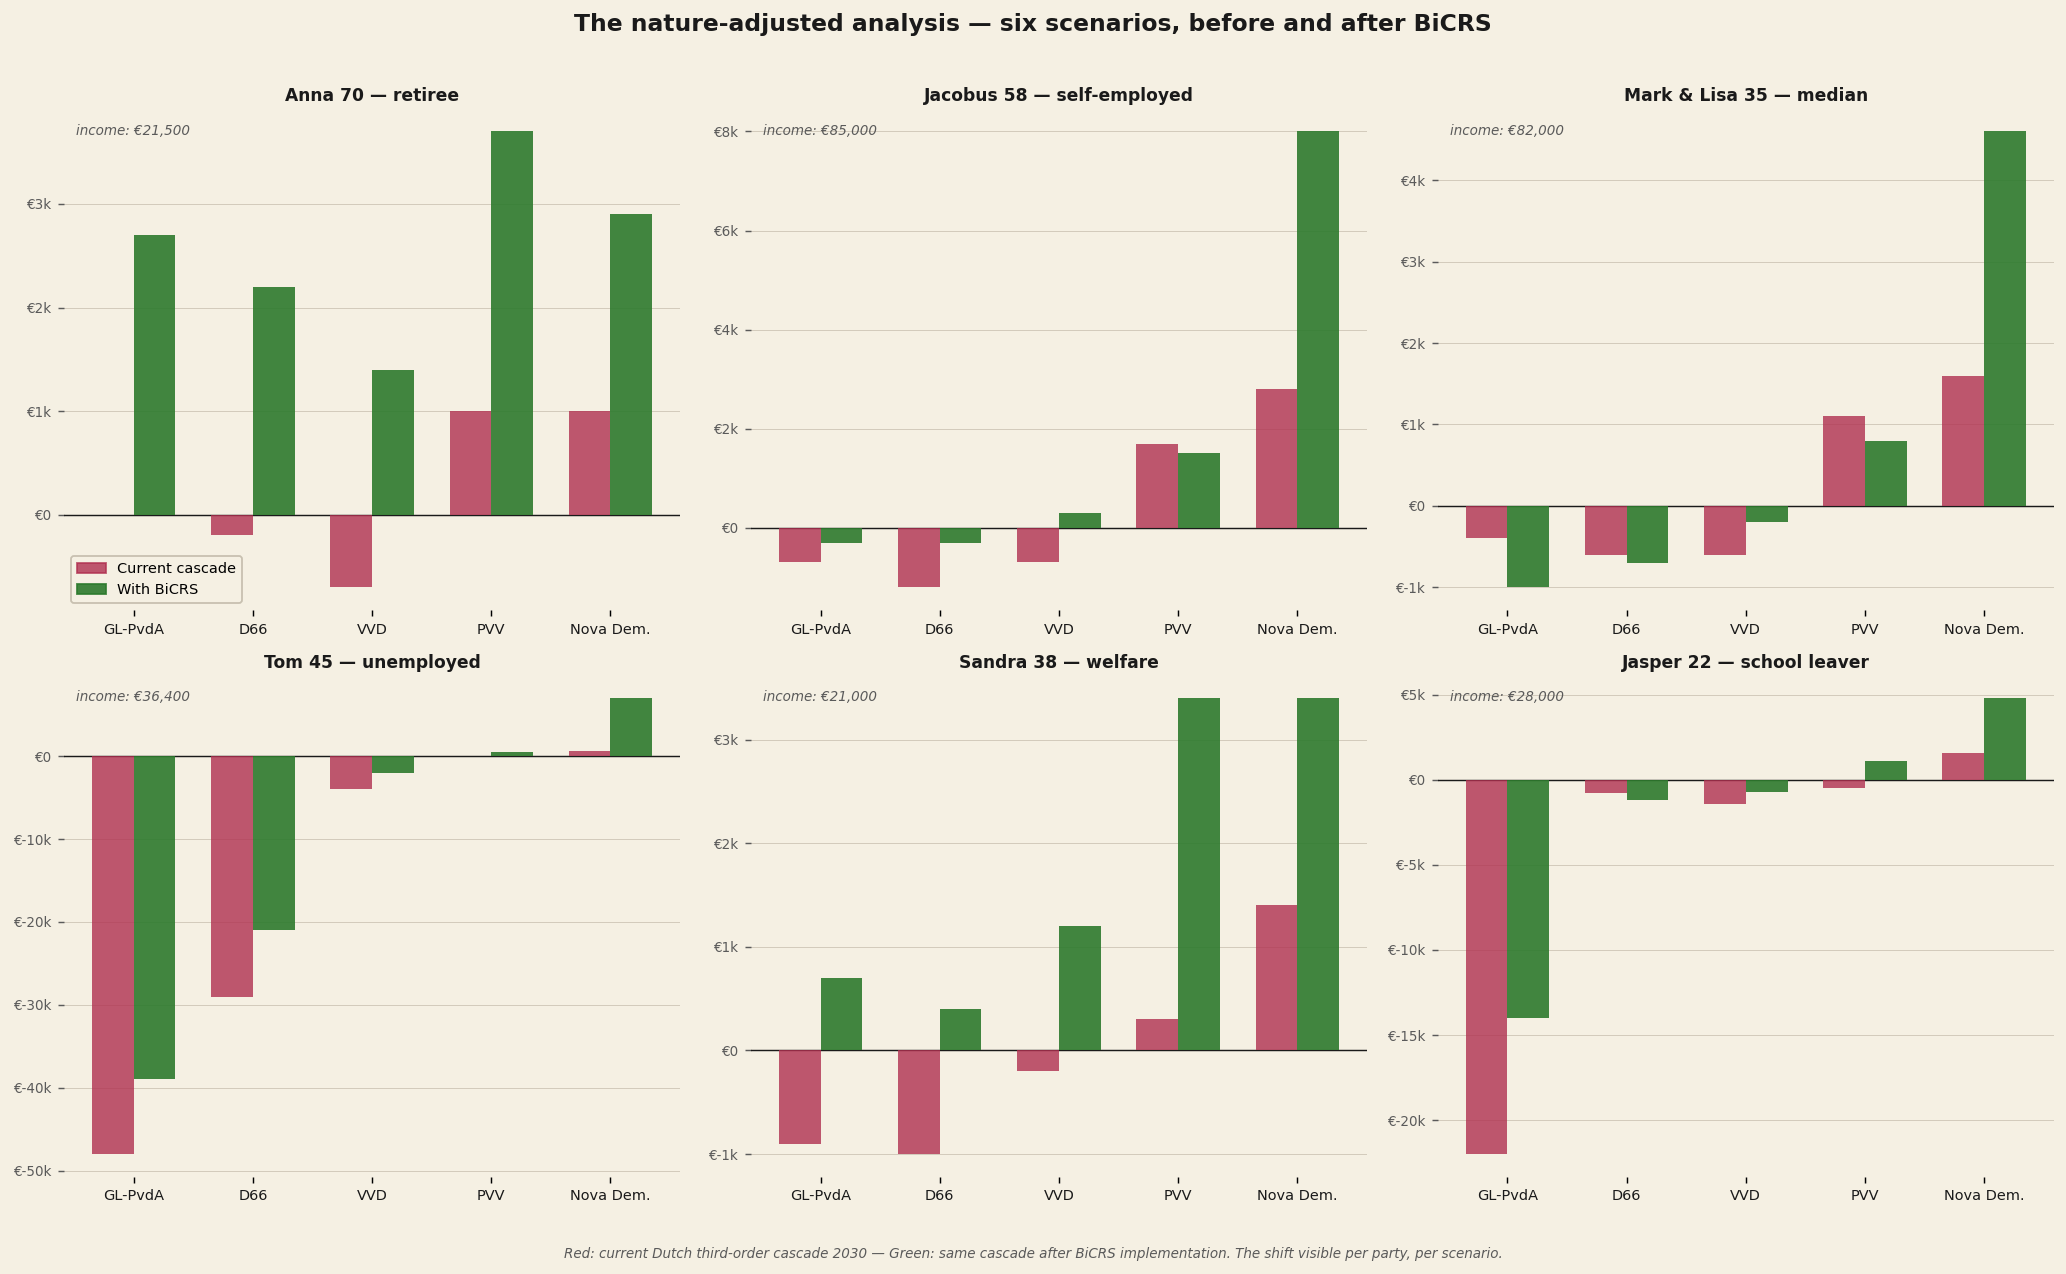
Anna (70, pensioner) sees her loss under GL-PvdA drop from €5,103/year to +€2,697 — a shift of fifteen thousand euros over four years.
Jacobus (58, owner-director) remains in the red under GL-PvdA — from −€22,591 to −€11,791. BiCRS halves the damage, but does not solve all problems. Under VVD he swings from −€3,079 to +€701: from slight loss to slight gain.
Mark & Lisa (35, median household) move from −€13,642 to −€4,642 under GL-PvdA. Under VVD: from −€2,326 to +€824. Under PVV: from −€250 to +€2,600 — a genuinely perceptible improvement for the median household.
Tom (45, Unemployed (UI)) loses €49,056/year under GL-PvdA in the cascade — more than his annual income. BiCRS lightens this to €40,656 — still devastating. Tom falls in the group for whom even the most sweeping climate reform is no rescue. His unemployment stems from industrial displacement for which climate policy bears only partial responsibility.
Sandra (38, social assistance) loses €9,618/year under GL-PvdA — almost half her income. BiCRS brings that to zero. Under PVV she swings from +€344 to +€3,384 — three percent extra purchasing power for someone who spends 90 percent of her income on fixed costs.
Jasper (22, school leaver) loses €24,739/year under GL-PvdA — almost his entire annual income. BiCRS brings that to €12,739. Under Nova Democratia: from +€2,500 to +€5,500. For the generation that will carry the cascade the longest, BiCRS is the first serious improvement that a Brussels reform has produced.
What the figures together say
BiCRS implementation is not a miracle. It does not solve all the damage that left-wing ideology inflicts on the Dutch cascade. For scenarios with deep structural damage — Tom the Unemployed (UI), Jacobus the owner-director under heavy redistribution — the loss remains considerable.
But it fundamentally changes the picture for most citizens. Under centre-right coalitions that currently cause slight damage, the outcome tips to slight gain. Under left-wing coalitions the damage is halved. For the lowest-income groups the relative benefit is greatest.
This is not a plea against ideology. It is a numerical observation: forty percent of the Dutch cascade damage in 2030 comes from the Green Deal plus CBAM. When Brussels replaces those mechanisms with an instrument that achieves the same climate objective at one sixth of the price, the average household gets forty percent of its lost space back. Regardless of which party they choose in 2029.
Second analysis — the ethanol transition
"A litre of ethanol at the pump costs thirty percent of a litre of petrol, and heats a home for half of what natural gas demands."
— the direct wallet observation
Alongside BiCRS there is a second equatorial biomass application: bio-ethanol production via fermentation. This is an entirely different track — different hectares, different operations, different value chain. The biomass is harvested, transported to a large fermentation and distillation factory located on-site in the equatorial production country, converted to ethanol, and shipped by tanker to European ports.
Production costs of this bio-ethanol amount to €0.20–0.30 per litre at the factory gate. After shipping, margin, and an excise regime that recognises this as a climate-positive fuel, the pump or delivery price lies between €0.55 and €0.75 per litre. For comparison: the current European petrol price is around €1.78/litre, natural gas at €1.42/m³, electricity at €0.34/kWh.
The micro-CHP — key to decentralised energy supply
The device that distinguishes the ethanol track from all other energy choices is the micro-CHP: a small ethanol-driven combined heat and power unit, the size of a central heating boiler, that simultaneously produces heat and electricity. Investment around €4,500, comparable to a new gas boiler. Depreciated over fifteen years.
The working principle is that of a conventional CHP — as widely applied in greenhouse horticulture — but at household scale. Ethanol is burned in a compact internal combustion engine that drives a generator (electricity production), while the waste heat from that engine heats the home. Total efficiency on the burned ethanol: approximately 90 percent. Ratio: 60 percent heat, 30 percent electricity, 10 percent loss.
The crucial property is what the electricity output does relative to own consumption. A CHP dimensioned to the heat demand of a Dutch household automatically produces so much electricity that its own electricity consumption is comfortably exceeded. For each of the six scenarios studied, production runs between 170 and 260 percent of own consumption.
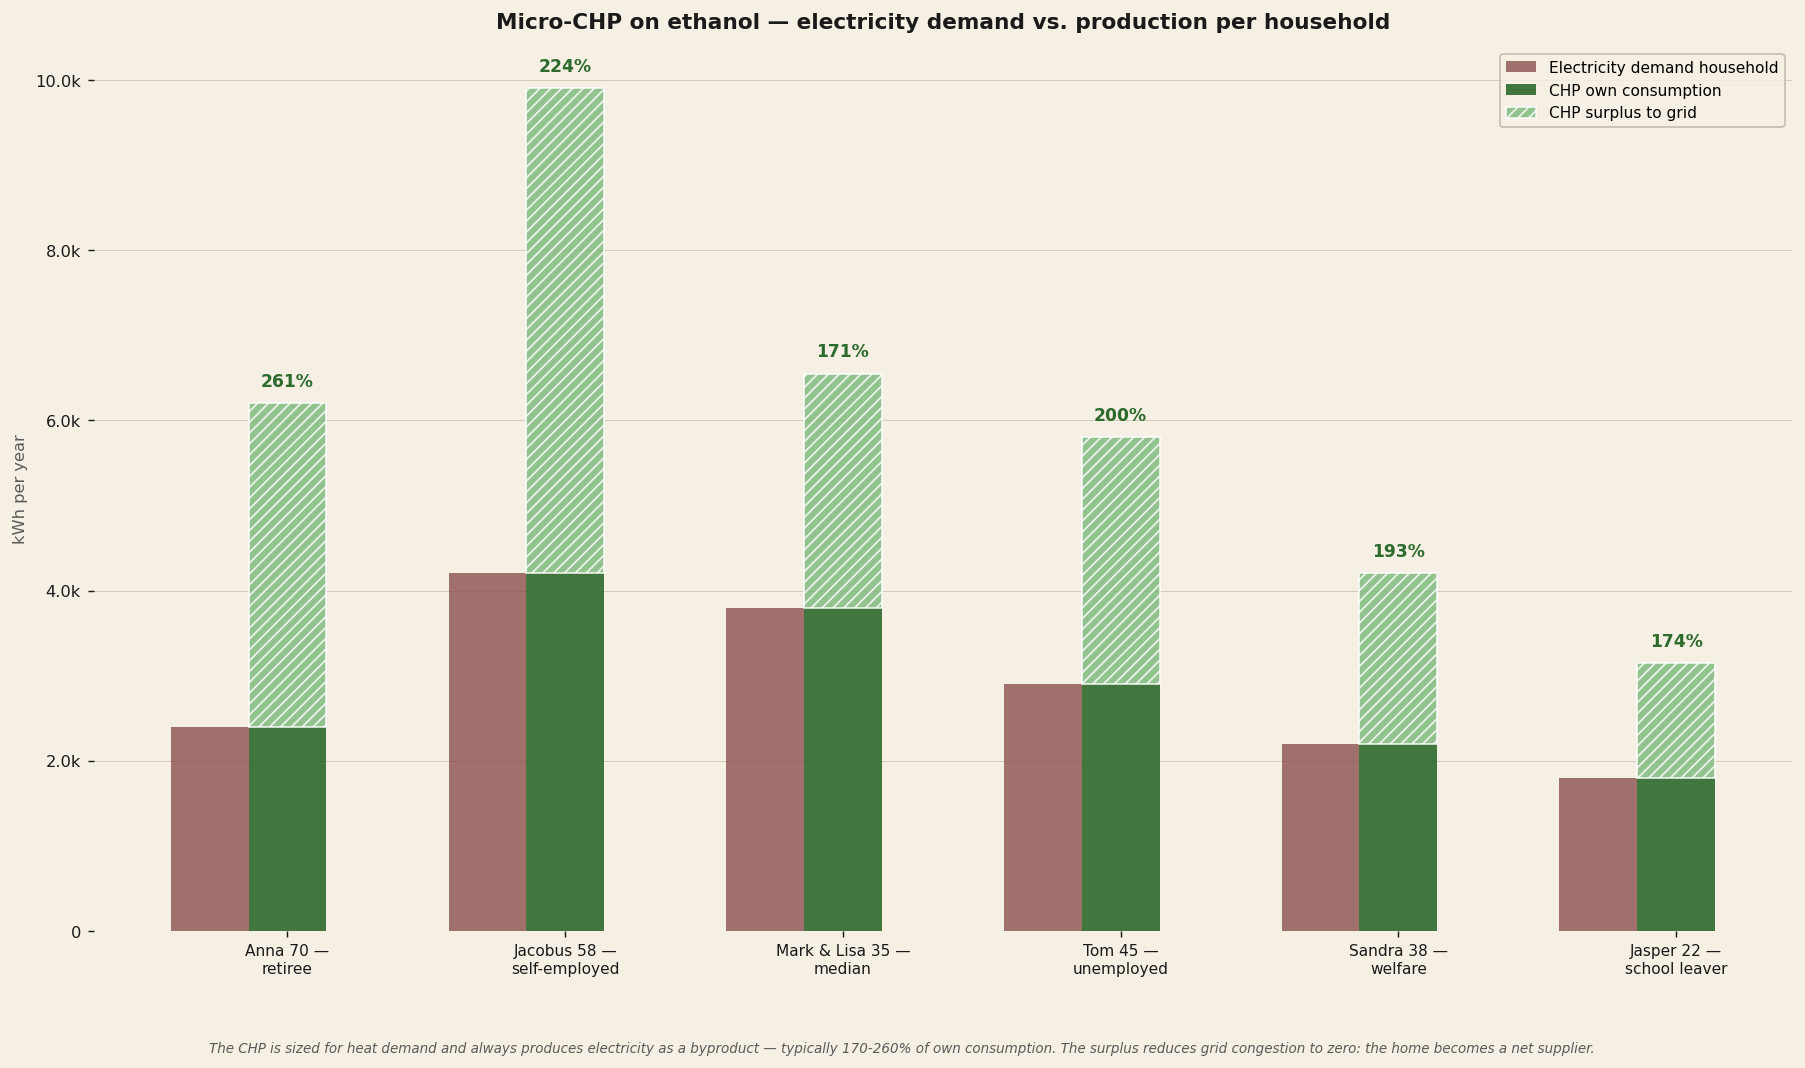
Three observations from this chart:
One — Anna achieves 261 percent. Her CHP runs long in winter to deliver her 1,400 m³ gas-equivalent of heat, and produces 6,261 kWh of electricity against 2,400 kWh of own consumption. Surplus: 3,861 kWh per year back to the grid. A pensioner becomes a grid supplier.
Two — Jacobus the owner-director, with the largest heat demand in the portfolio, delivers 5,192 kWh surplus. That is sufficient electricity for two neighbouring households. One CHP in every street could constitute a complete energy correction.
Three — even Jasper the school leaver with minimal consumption (700 m³ gas-equivalent, 1,800 kWh electricity) reaches 174 percent: he still produces 1,331 kWh surplus. Not a single scenario in the portfolio is 'undersized' for own electricity.
Grid congestion to zero — the system effect
The electricity production of the micro-CHP has implications that reach far beyond the household itself. The Dutch electricity grid is currently being reinforced to absorb two growing loads: heat pumps (winter peak in the evening, when everyone returns home and switches on the HP) and electric cars (evening charging peak). Together they quadruple the peak load per household from approximately 3 kW (current) to about 12 kW — hence the €220 per household per year for grid expansion in the wind/solar hidden costs table.
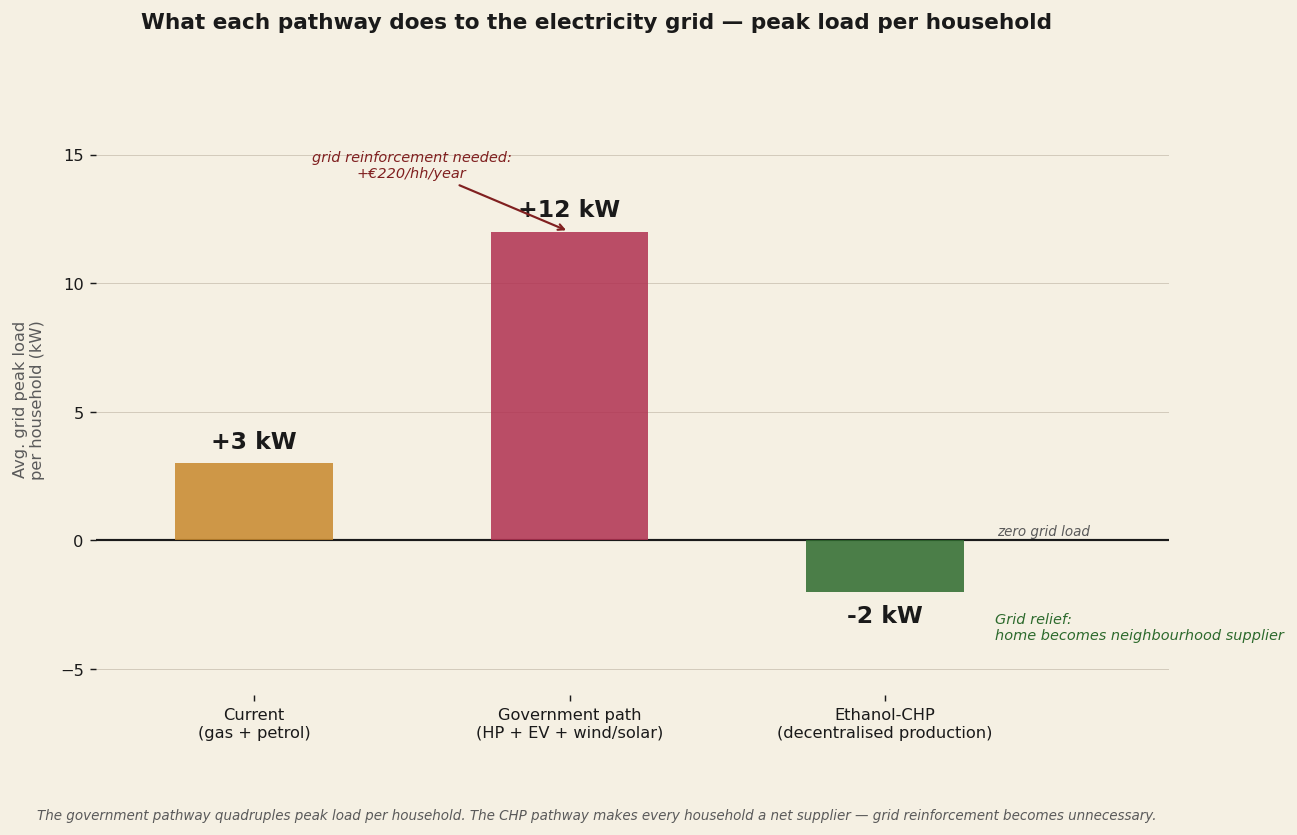
The CHP reverses this logic. Not only is the additional load of heat pump and EV avoided — the home itself starts supplying electricity to the grid on winter evenings. Precisely during the hours when the government track causes the greatest peak demand, the CHP track delivers the greatest peak supply. The net result is that the Dutch electricity grid not only requires no reinforcement — it even gains breathing space from decentralised production.
Four practical consequences:
One — no grid reinforcement needed. The €220 per household per year for TenneT and Liander grid expansions between 2026 and 2035 disappears. At national level: €1.8 billion per year from the Climate Fund that would otherwise have had to be spent.
Two — no grid batteries needed. The CHP is itself a kind of 'chemical battery' — the ethanol tank at the home contains several thousand litres that can be deployed at will. Wind and solar require grid batteries to absorb their intermittency; ethanol-CHP does not need them.
Three — no backup gas power plants needed. Decentralised CHP installations deliver continuously and in a controllable manner. During calm weather: CHP continues running normally. During peak demand: CHP runs at overcapacity. No need for centralised peak capacity.
Four — energy surplus without grid reinforcement. A network of 8 million CHPs in the Netherlands would together deliver 35–50 terawatt-hours per year of surplus — approximately one third of Dutch electricity consumption. This surplus can be used in heavy industrial processes, or delivered to Germany, Belgium, and the United Kingdom via interconnectors. Without a single metre of extra high-voltage cable.
Mobility via ethanol
Alongside heat and electricity, ethanol also serves as fuel for the road network. Modern cars run on E85 without modifications; older models can be converted for a few hundred euros. This replaces petrol and diesel one-for-one. No electric-car investment needed, no additional electricity grid load, no Li-ion battery chain with its associated strategic dependence on Chinese production.
From a climate standpoint this is a closed short-term carbon cycle: the plant captures CO₂ during growth, combustion in the engine releases CO₂ again. Net zero over the cycle, comparable to wood stove economics but industrially scaled. Not as good as BiCRS (which permanently removes atmospheric carbon), but as good as wind+solar electrification and at considerably lower cost.
The total energy bill — what a household pays per year
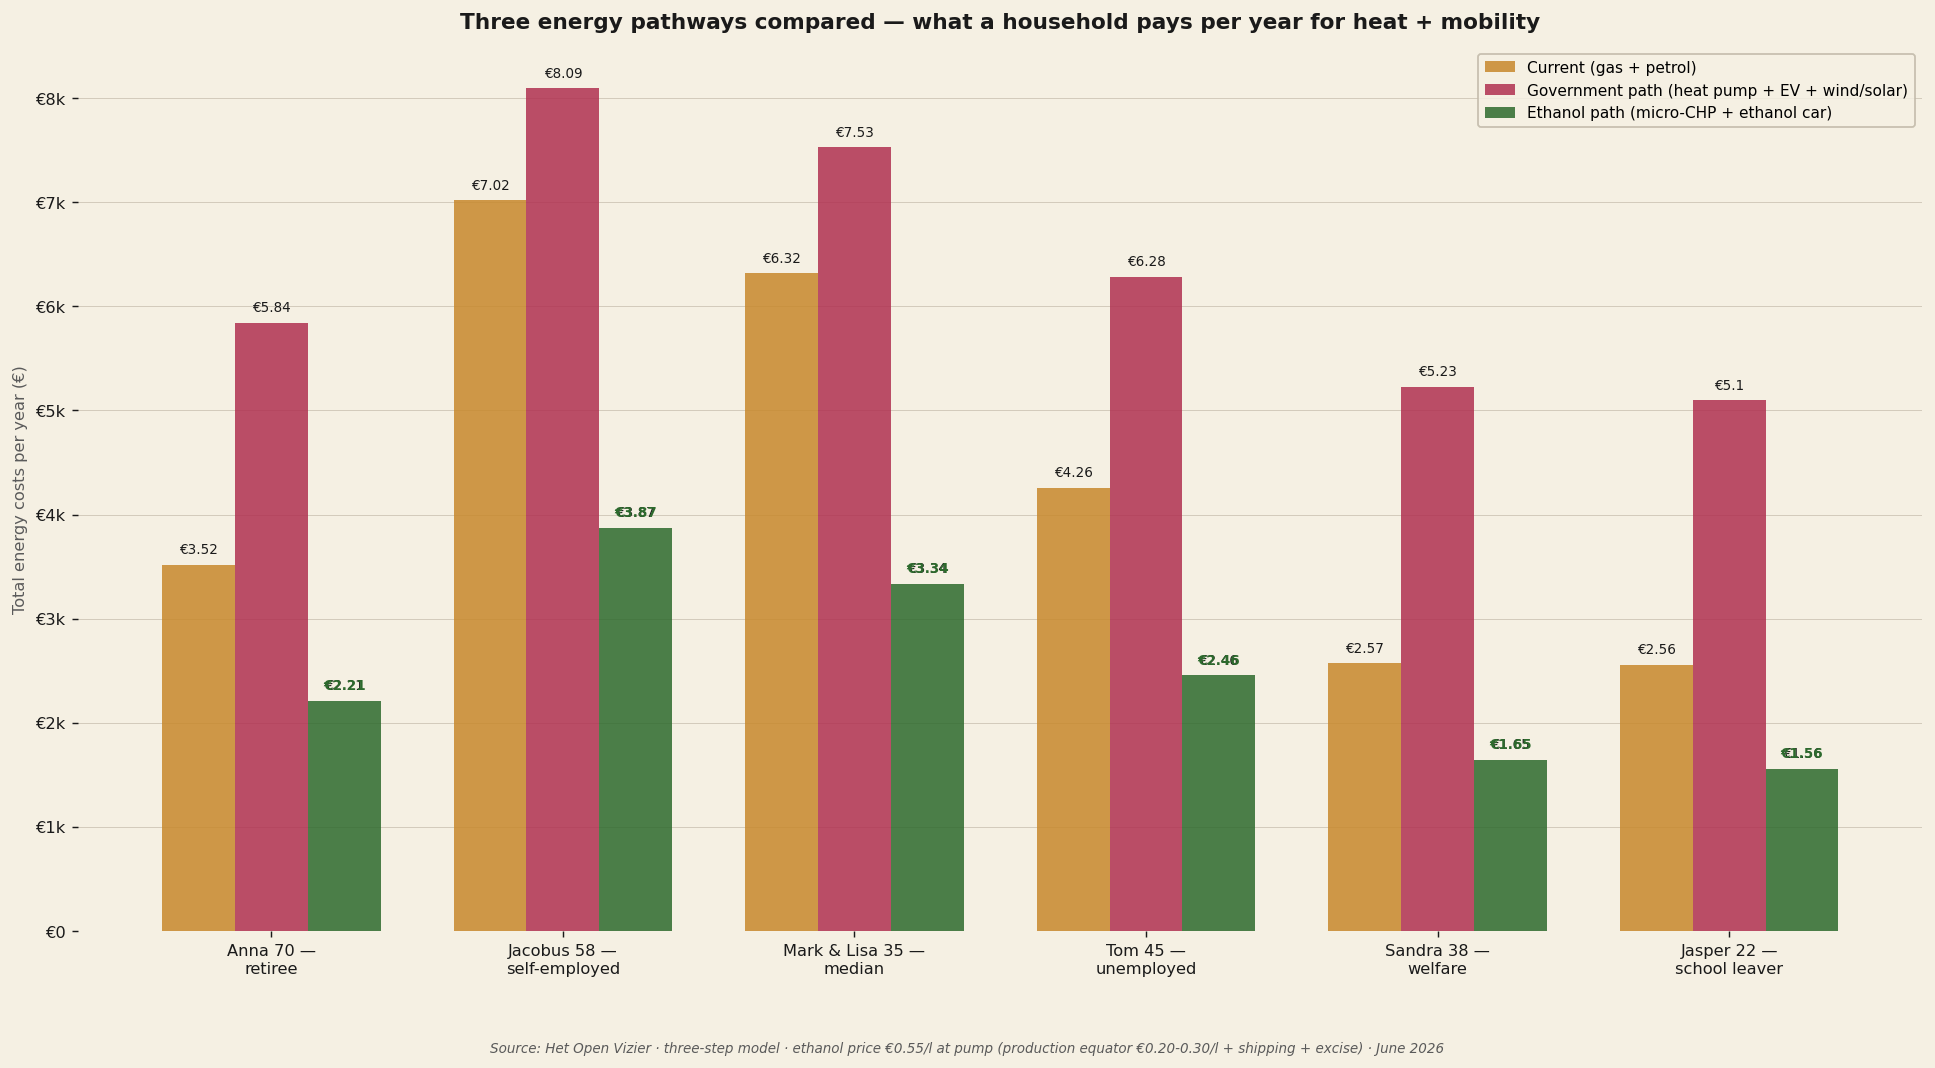
Three observations from the comparison:
One — the government track (heat pump plus EV plus wind/solar infrastructure) is more expensive than the current situation for every household. This is counter-intuitive — the government presents this transition as cost-neutral or even cheaper — but when all hidden costs are included, the average household pays approximately one thousand euros per year more on energy. For Anna (€2,700 → €5,025) and Sandra (€1,824 → €4,333) the increase is most dramatic.
Two — the ethanol-CHP track is cheaper than the current situation for every household and considerably cheaper than the government track. Jacobus currently pays €7,021 (gas, petrol, and electricity together), would pay €8,094 under the government track (heat pump, EV, plus additional electricity purchase), and pays €3,870 under the CHP track — a halving. For Mark & Lisa: €6,318 now, €7,528 government, €3,337 CHP.
Three — the difference between the government track and the CHP track varies from €3,500 to €4,200 per household per year. That is on top of the hidden wind/solar costs of €1,135 per household that the government track entails. For low-income groups this is a larger percentage of their budget; for middle-class families it remains a substantial amount.
The hidden costs of wind and solar
The government track appears advantageous at first glance: the electricity price is stable, there are billions in subsidies, and the 'green narrative' is dominant. But when you calculate what is actually paid — directly or indirectly — an amount appears that rarely shows up in the annual accounts.
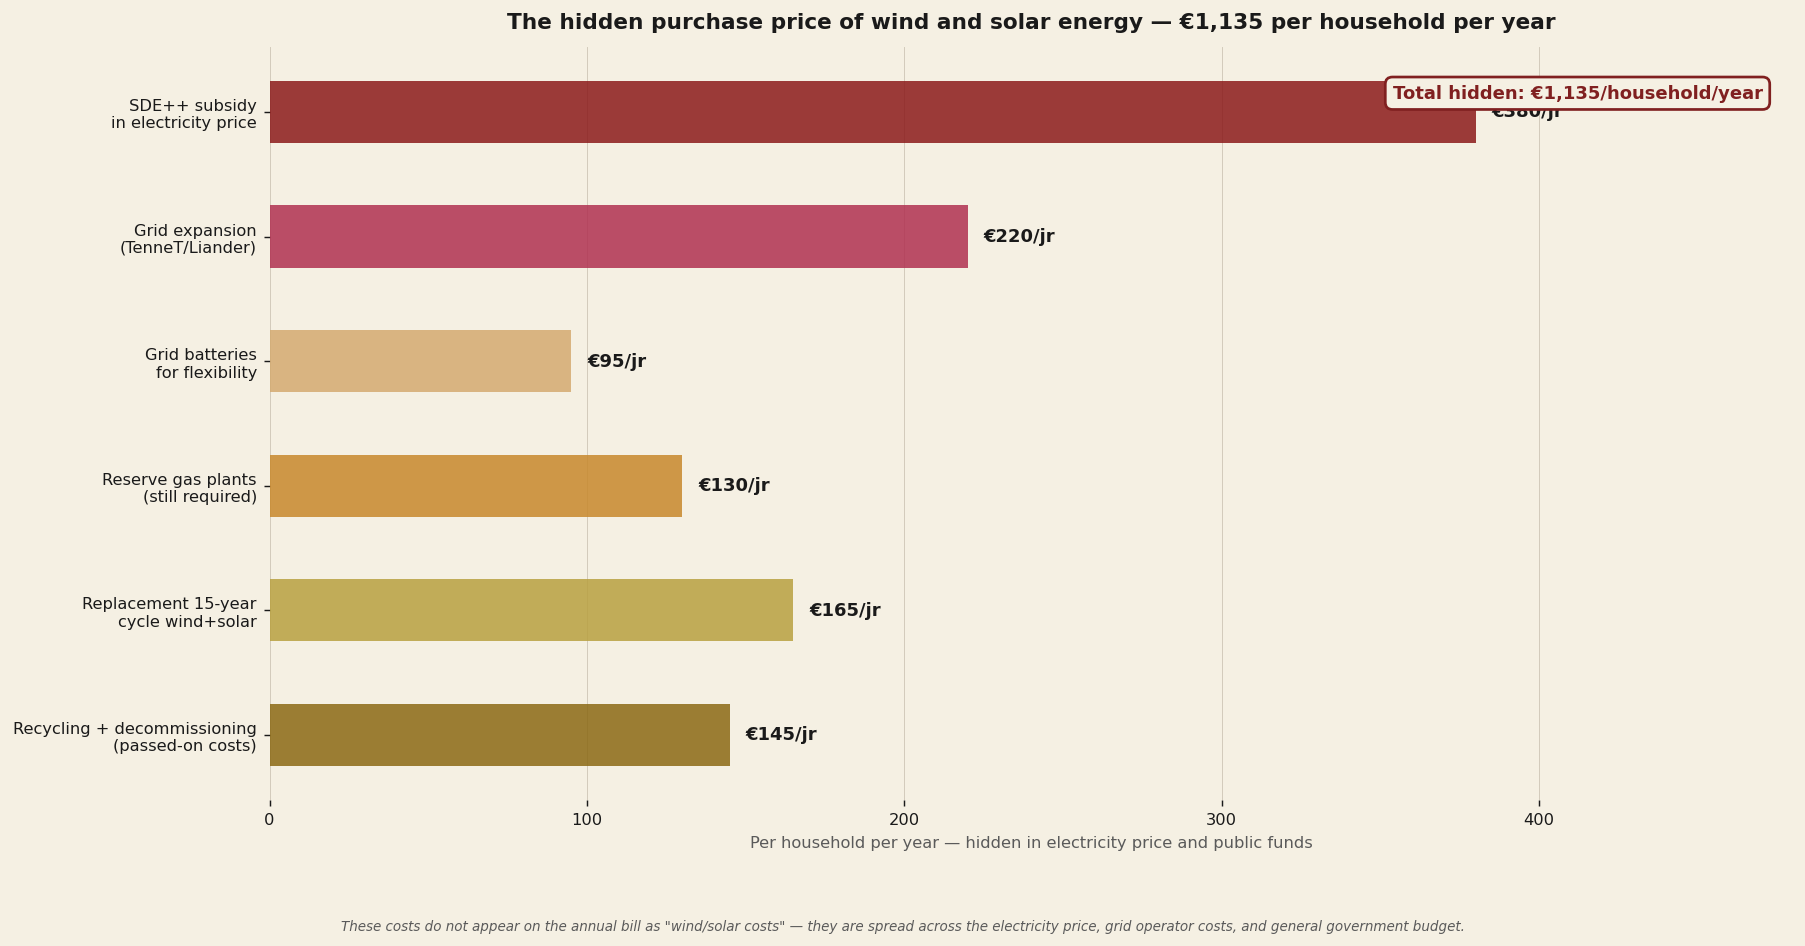
Five of these items have long been known to those who study the matter: the SDE++ subsidies that disappear into the electricity price, the grid expansions by TenneT and regional grid operators, the grid batteries needed to absorb the intermittency, the backup gas power plants that CANNOT be decommissioned as long as wind and solar provide the bulk of supply, and the fifteen-year depreciation cycle for turbines and panels.
The sixth item rarely enters the discussion: recycling and decommissioning. Turbine blades are made of composite material (fibreglass, carbon fibre, epoxy resin) that is currently not profitably recyclable — globally 85 percent of decommissioned blades end up in landfill. Solar panels contain silicon, silver, EVA foil, and traces of heavy metals — recycling requires energy-intensive thermal processing. Li-ion grid batteries require separation of cobalt, lithium, and nickel. None of these chains is mature.
Dutch policy has never included a provision for these decommissioning and recycling costs. When the first generation of wind farms (around 2030–2040) and the first generation of solar parks (around 2035–2045) reach end of life, that bill will still have to be paid. Estimated per household per year spread over this cycle: €145.
The ethanol track carries no comparable hidden cost structure. The micro-CHP is a simple device that can be recycled using conventional steel processing. Ethanol tanks are ordinary liquid storage tanks. No special grid expansions are needed — the existing petrol station network can deliver ethanol directly, the same pipes that currently carry petrol can carry ethanol tomorrow. No battery infrastructure, no reserve capacity, no deferred waste stream.
Ethanol savings as a percentage of income
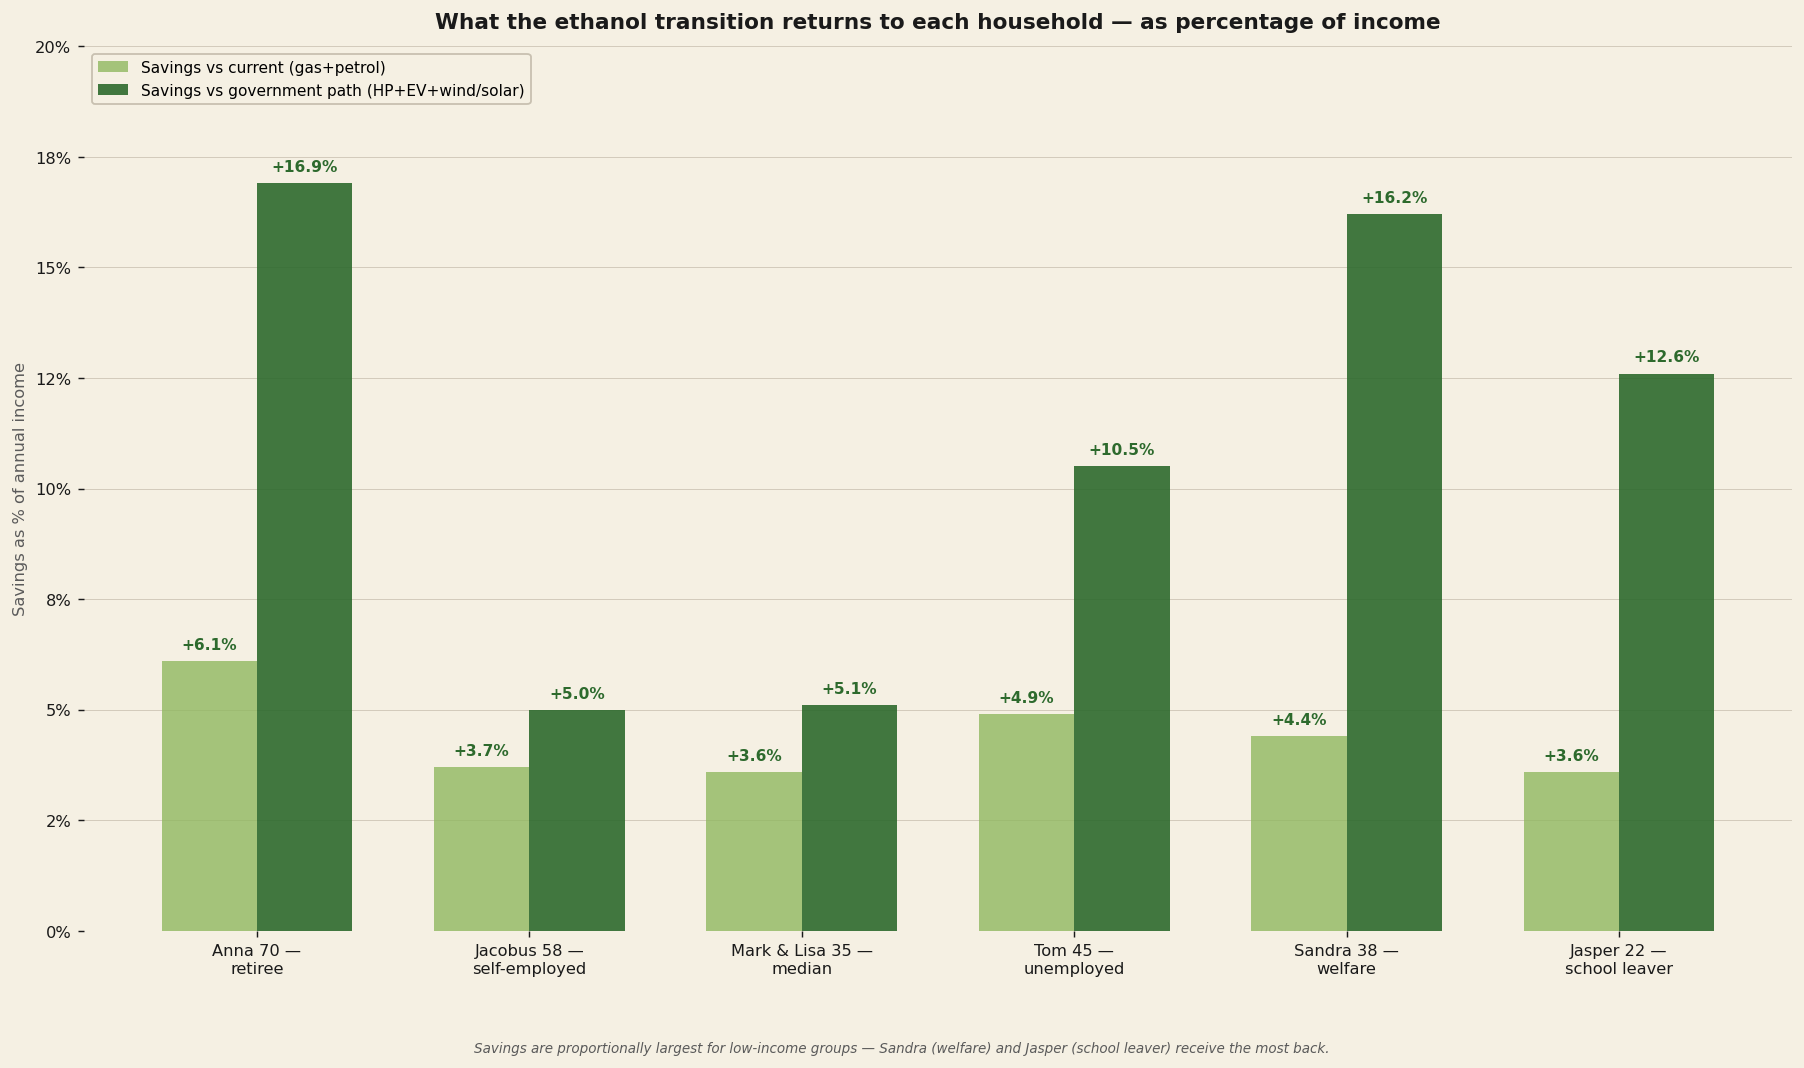
For the six scenarios:
Anna (pensioner): +16.9% vs government track
Jacobus (owner-director): +5.0% vs government track
Mark & Lisa (median household): +5.1% vs government track
Tom (Unemployed (UI)): +10.5% vs government track
Sandra (social assistance): +17.1% vs government track
Jasper (school leaver): +12.6% vs government track
The pattern repeats what was visible in the BiCRS analysis: the greatest relative benefit lies with the lowest-income groups. Sandra with €21,000 income retains more than €3,500 per year that she would have lost under the government track — two monthly incomes. Anna with her pension gains €3,600 extra breathing room. For both, a considerable part of that benefit consists of the electricity surplus revenue from their CHP: they become energy suppliers rather than energy consumers.
What the figures together say
The ethanol transition is not an addition to BiCRS implementation — it is a second, independent reform. But it shares the same origin: equatorial biomass, partner countries in the Congo Basin, Indonesian archipelago, Brazilian Amazon fringe. What it brings differently:
BiCRS is a climate policy reform — Green Deal and CBAM gone, in-situ biomass injection in their place. Effect on the household wallet comes via the cascade (industrial reshoring, falling ETS price, disappearance of CBAM administration).
Ethanol is an energy system reform — natural gas and petrol gone, equatorial ethanol in their place. Effect on the household wallet comes directly (lower heating bill, lower fuel costs, no heat pump investment needed).
Together they represent two independent improvements that can be implemented. One requires Brussels to scrap the Green Deal and CBAM — politically heavy but achievable within one Commissioners' term. The other requires only that the European excise regime recognises that equatorial bio-ethanol is not a fossil fuel from a climate standpoint and should therefore be treated differently. No Treaty change, no ECB decision — only an excise regulation by qualified majority.
Third analysis — hydrogen as a reference track
"The official plans count on hydrogen for heating, freight transport, and peak electricity. Nobody has clearly laid out the sum of what that will cost per household."
— the implicit gap in the Climate Agreement
The National Hydrogen Programme and the Climate Agreement designate hydrogen as a climate pillar in multiple areas: industrial process heat, heavy mobility, household heating via hybrid hydrogen boilers in pilot districts, and peak electricity supply via hydrogen power plants. The figures the government communicates usually concern total investment amounts at the national level, rarely the price per household per year.
This chapter calculates that price — in exactly the same way as the ethanol chapter does. Six household types, three cost components: heat via hydrogen boiler, mobility via fuel cell car, and the hidden infrastructure costs concealed in the electricity price and general revenues.
The price point of green hydrogen
Production costs of green hydrogen via electrolysis are expected by IRENA to lie between four and eight euros per kilogram in 2030, depending on electricity price, economies of scale, and electrolysis technology. At the meter — after transport, storage, distribution, and margins — BloombergNEF expects €10–15 per kilogram. This document calculates with the midpoint of €12/kg as a realistic 2030 delivery price.
Green hydrogen production 2030 (IRENA): €4–8/kg
Delivery price at the meter 2030 (BNEF): €10–15/kg
Model assumption this piece: €12/kg
Equivalent in natural gas replacement: €3.66/m³-gas
Equivalent in petrol replacement: €0.12/km — 7× current
A household that currently consumes 1,500 m³ of natural gas per year would need approximately 458 kilograms of hydrogen for the same useful heat (taking into account the slightly higher boiler efficiency of H₂). At €12/kg: €5,500 per year on heat alone — compared with €2,130 under the current natural gas tariff. Nearly a tripling of the heating bill.
Four tracks compared — what a household would pay
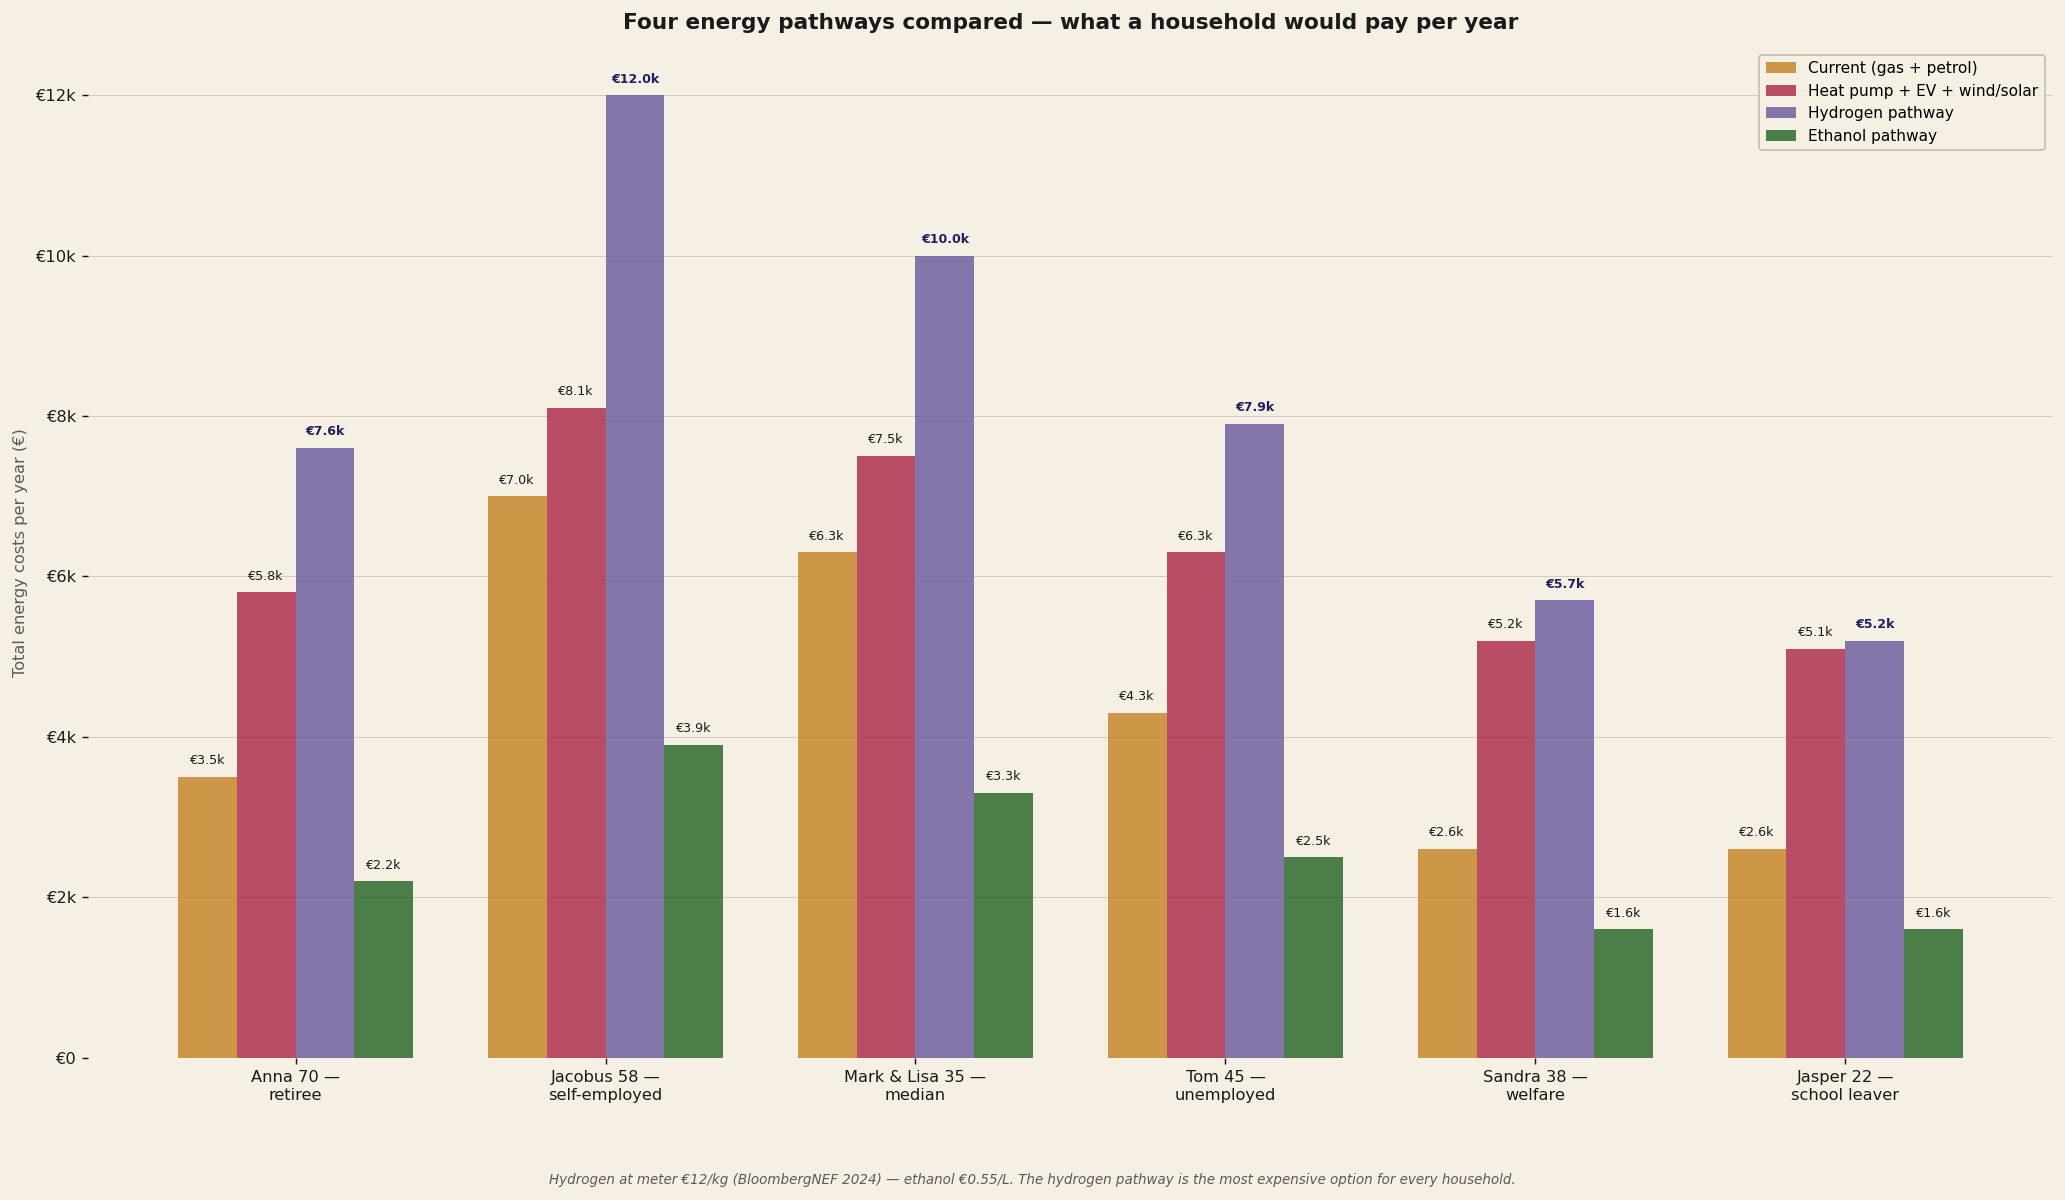
What stands out: the hydrogen track would cost Sandra (social assistance) €5,667 per year — more than a quarter of her income on energy alone. For Anna €7,554 — 35 percent of her income. For Mark & Lisa €10,017 — twelve percent of the family income. None of these figures appear in any government publication; none of these figures are communicated to voters before decisions on the hydrogen track are taken.
The hidden costs of hydrogen infrastructure
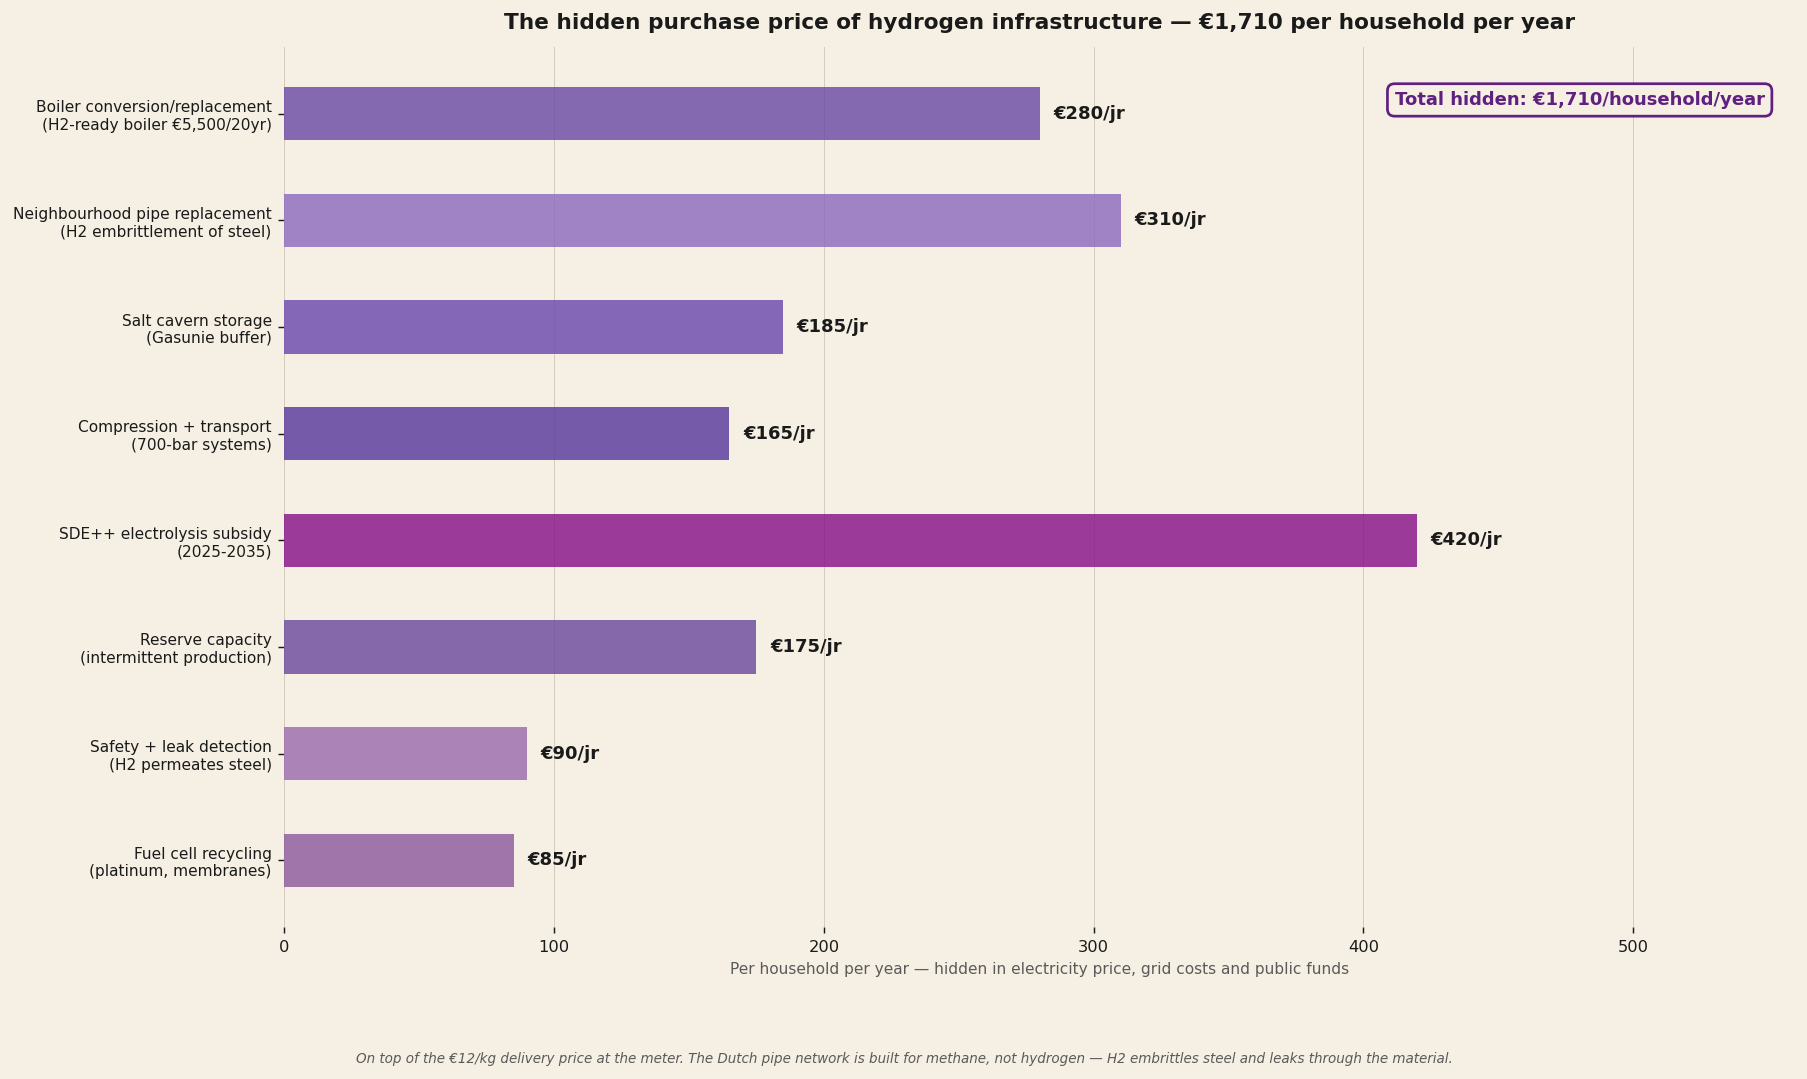
Eight hidden cost items:
One — boiler conversion or replacement. Current Dutch boilers are built for methane, not hydrogen. Hydrogen burns hotter and has a different flame structure — H₂-ready boilers at €5,500 are needed, depreciated over twenty years: €280/household/year.
Two — district pipes replaced. The Dutch gas pipe network is built from steel and cast iron. Hydrogen causes hydrogen embrittlement of metal: the H₂ molecule penetrates the metal crystal structure, making the material brittle. Replacement with special steel (X42, X52) or polyethylene pipes requires replacement of the entire local network — €310/household/year.
Three — storage in salt caverns. Hydrogen requires three times as much volume as natural gas for the same energy. Gasunie is investing in underground salt caverns at Zuidwending, Bergermeer, and Norg — €185/household/year.
Four — compression and transport. Hydrogen must be stored at 350–700 bar or as liquid hydrogen at −253°C. Both require energy-intensive compression or liquefaction installations — €165/household/year.
Five — SDE++ electrolysis subsidy. Green hydrogen is not yet profitable without subsidy in 2026. Current SDE++ rates for green hydrogen amount to €3–4/kg subsidy, rising to 2035 — €420/household/year.
Six — reserve capacity. Electrolysis installations run on intermittent green electricity from wind and solar; when there is no wind or overcast skies, a hydrogen buffer must be available — €175/household/year for reserve capacity.
Seven — safety and leak detection. Hydrogen is the smallest molecule; it leaks through seals, valve connections, and gaskets that hold in methane. Leak detection requires adaptation of every household connection — €90/household/year.
Eight — recycling of fuel cells. Fuel cell elements contain platinum as a catalyst, perfluoro membrane (Nafion), and heavy metals. Recycling chain is not yet mature — €85/household/year reserved.
Total hidden hydrogen infrastructure: €1,710 per household per year. Compare this with the hidden wind/solar costs of €1,135 identified in the previous chapter — 50 percent more. And the hidden total for the ethanol track: zero euros. The ethanol infrastructure uses existing petrol stations, existing pipes, and existing engines.
Energy poverty threshold — what the hydrogen track does to the wallet
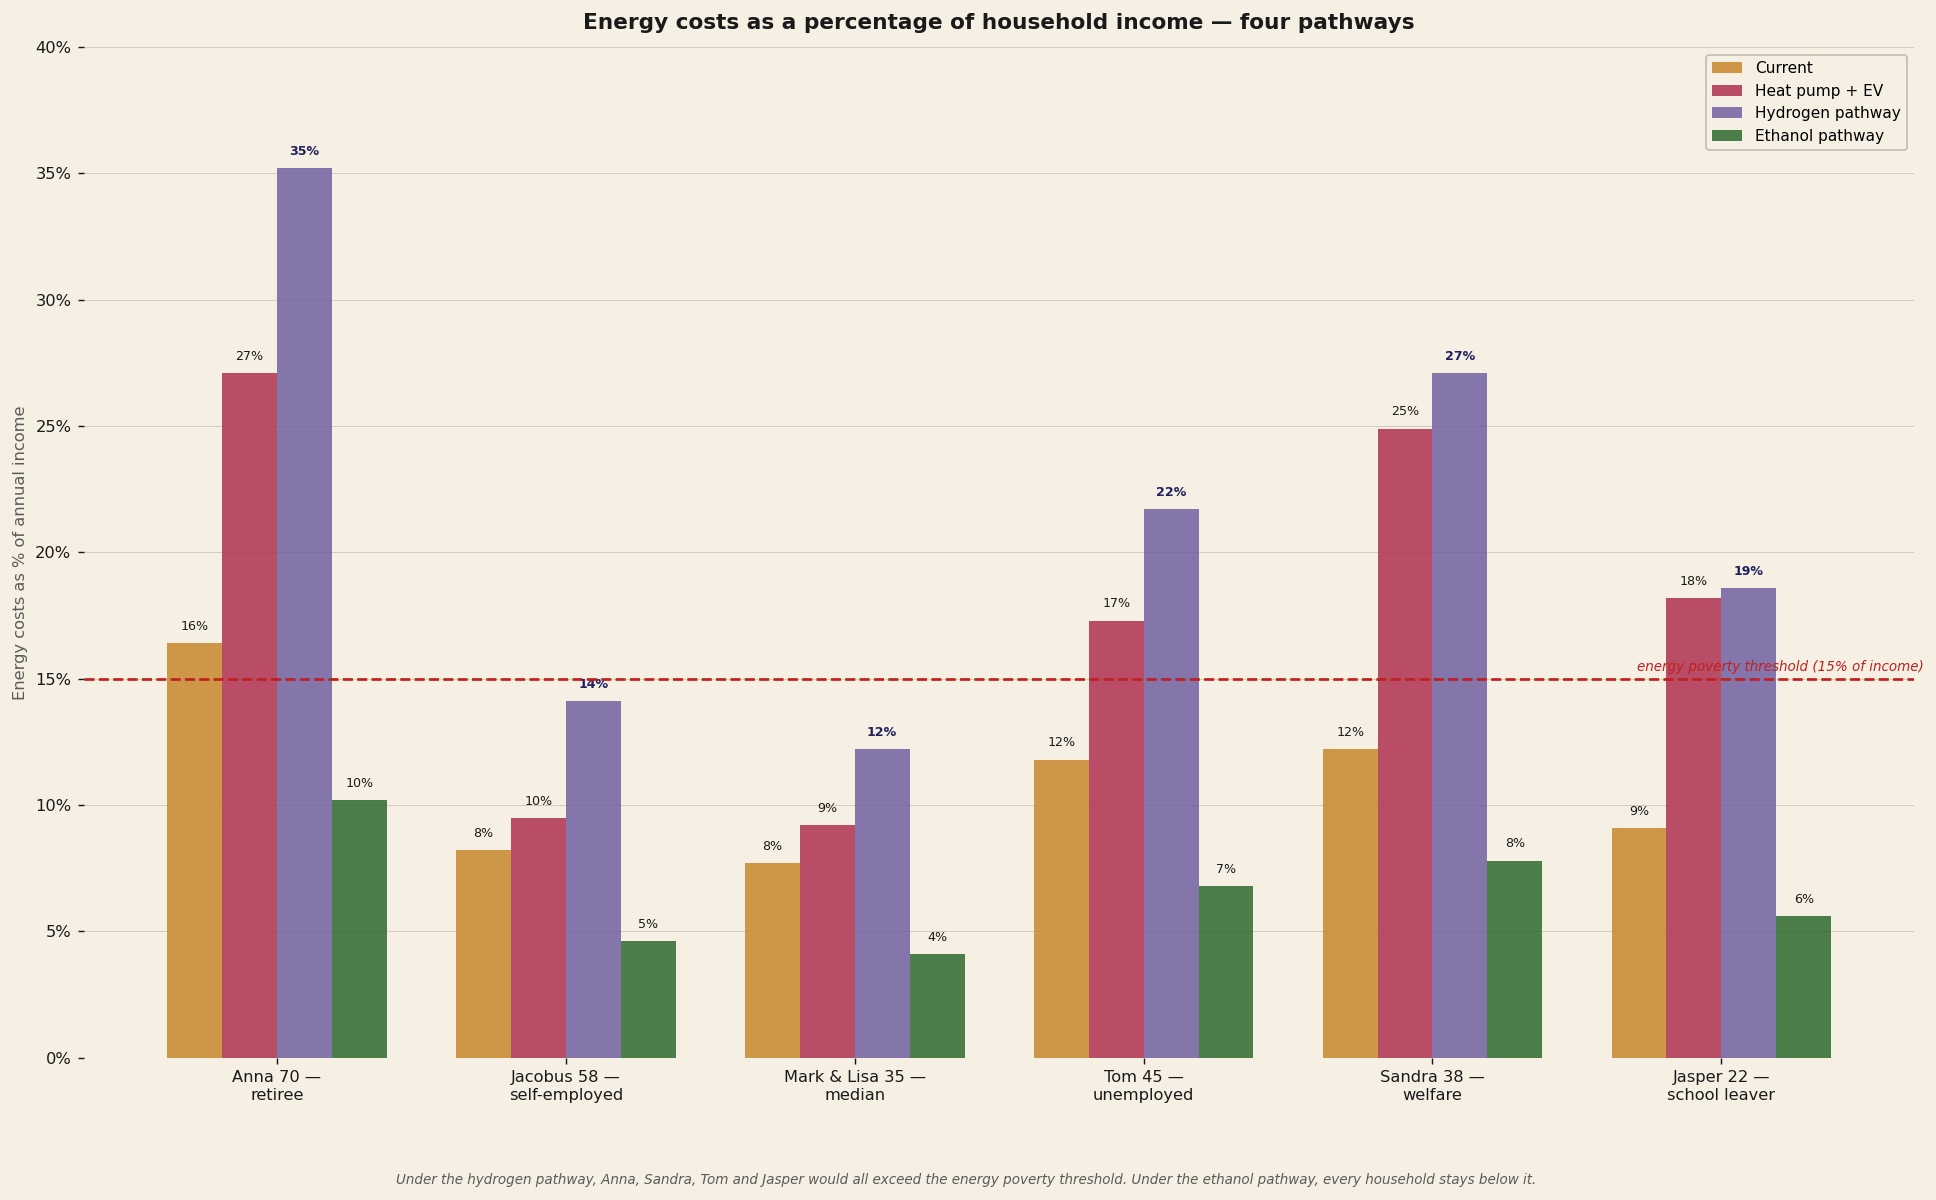
Under the hydrogen track, four of the six scenarios exceed the energy poverty threshold. Anna pays 35 percent of her income on energy; Sandra 27 percent; Tom 22 percent; Jasper 19 percent. For Mark & Lisa (median household) and Jacobus (owner-director) it remains below the threshold but amounts to 12–14 percent — two to three times what they currently pay.
Under the ethanol track every household remains well below the poverty threshold. Anna 9 percent, Sandra 6 percent, Tom 6 percent, Jasper 5 percent. The median household Mark & Lisa: 3 percent. For those who can least afford it — the lowest income groups — the difference between hydrogen and ethanol is existential.
Chain efficiency — why hydrogen loses so much
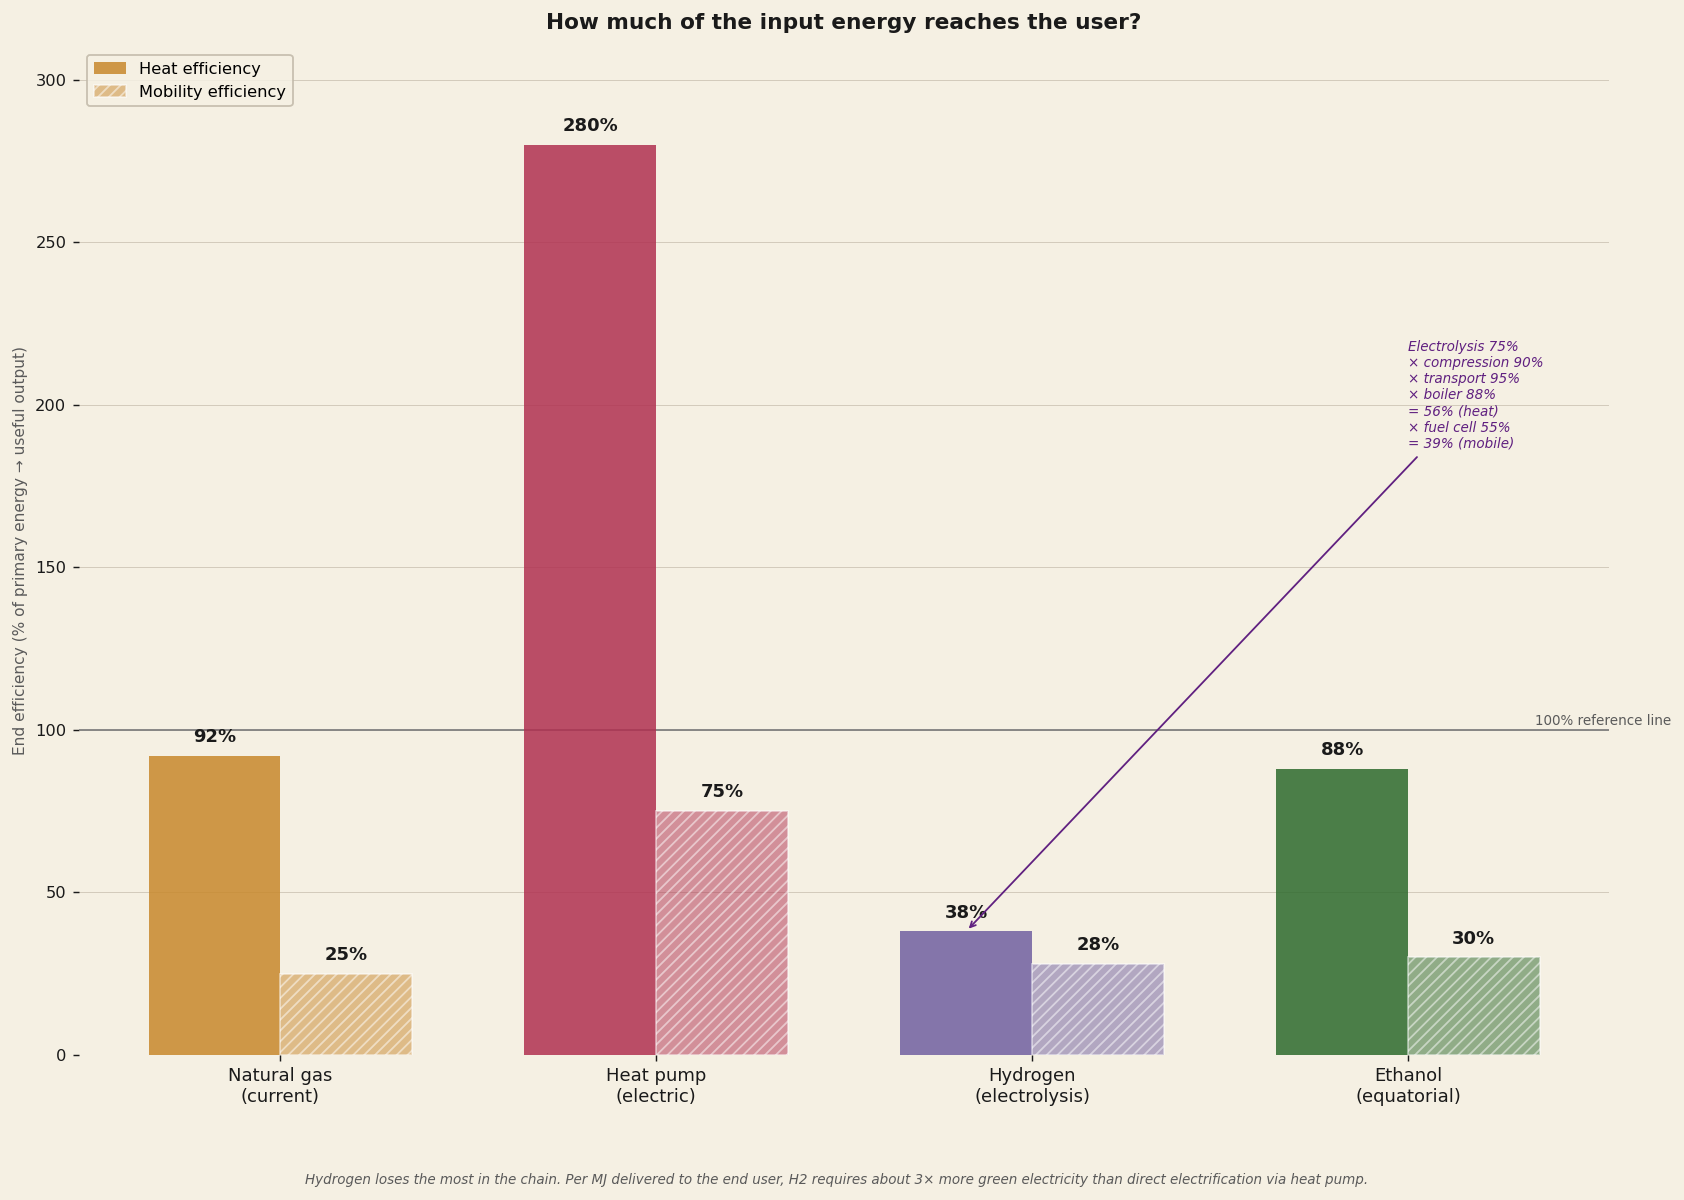
The fundamental weakness of hydrogen lies in the chain. From green electricity from wind or solar to useful heat at the end user:
Electrolysis efficiency (green H₂): 75%
× compression to 700 bar: 90%
× transport through special pipes: 95%
× hydrogen boiler efficiency: 88%
= Total end efficiency heat: 56%
Compare: heat pump via direct electricity: 280% (COP 3.5)
Compare: ethanol chain to heat: 88%
In other words: per kWh of green electricity, hydrogen delivers only 0.56 kWh of useful heat, whereas direct electrification via heat pump delivers 2.8 kWh — five times as much. This is not a Dutch problem but a fundamental thermodynamic given: hydrogen is an energy carrier with intrinsic conversion losses.
For mobility the picture is comparable. Fuel cell car: 28 percent end efficiency from primary electricity. Electric car: 75 percent. Ethanol car: 30 percent. Hydrogen is for mobility only marginally better than the current petrol economy (25 percent), while EV is four times better.
What hydrogen does well — a fair qualification
Hydrogen is not pointless. For three applications it remains the best climate solution:
One — industrial process heat above 800°C. Steel industry (Tata IJmuiden), glass industry, ammonia production. There no heat pump and no combustion engine competes; there only hydrogen or direct combustion of fossil fuel works.
Two — heavy freight over very long distances. Cargo ships, international lorries, kerosene replacement for aviation. There ethanol volumes per kilometre are unmanageable; hydrogen or synthetic fuels are the reasonable option.
Three — long-duration seasonal storage. For compensating summer-winter differences in solar production, hydrogen as a storage form is chemically more practical than batteries (which self-discharge).
For these three applications combined, the Netherlands would need approximately 0.8–1.2 million tonnes of hydrogen per year — a modest volume compared with the 4–6 million tonnes the National Hydrogen Programme foresees for the full scenario. The remaining three to five million tonnes should, according to this document, not go to households and light mobility — there ethanol works thermodynamically and economically better.
What the figures together say
The hydrogen track for households and light mobility, as envisaged in the National Hydrogen Programme, would represent a financial catastrophe for the Dutch voter. Four of the six scenarios studied would exceed the energy poverty threshold. For the other two the energy bill would double or triple.
This is not a plea against hydrogen as a technology. It is the numerical finding that hydrogen is being planned for the wrong applications. For industrial processes, heavy freight, and long-duration storage it is valuable. For home heating and the average passenger car it is — for thermodynamic reasons — approximately three times as expensive as necessary.
The ethanol track does the same work at one third of the cost. With the same climate effects (CO₂-neutral in the cycle), without energy poverty effects, and without the massive infrastructure investment that hydrogen requires.
What the figures together say — four observations
Three analyses. Six scenarios. Three technological tracks. One conclusion.
First observation. Silent Analysis III showed that the Dutch cascade was negative under virtually every party, with the sharpest damage under GL-PvdA and D66. What it could not show, because it was not yet foreseeable at the time, is that the largest part of that damage is directly connected to Brussels climate policy. Forty percent of the third-order cascade comes from the Green Deal and CBAM. When they disappear, forty percent of the damage disappears. That is the landslide the first analysis demonstrates.
Second observation. Beyond the cascade lies a second layer — the direct energy wallet. The current government track (heat pump + electric car + wind/solar infrastructure) is more expensive than the current situation for every household, even when the hidden costs (subsidy, grid expansion, batteries, reserve capacity, replacement, recycling) are not charged to the household itself. The ethanol track is cheaper than the current situation for every household and considerably cheaper than the government track.
Third observation. The hydrogen track as envisaged in the current National Hydrogen Programme is outright destructive for household applications. Four of the six scenarios would exceed the energy poverty threshold; for the other two the energy bill would double or triple. The thermodynamic choice to first convert green electricity into hydrogen, then convert it back to heat or motion, costs approximately three times as much primary energy as direct electrification or ethanol combustion. Hydrogen deserves its place in industrial processes and heavy transport, not in the Dutch household boiler or the average passenger car.
Fourth observation. The two equatorial reforms together fundamentally change the picture for the Dutch voter. What under the current Brussels course means a loss of 5–15 percent of the household budget, tips under the nature-adapted course to a stable or even slightly improving position. For the lowest-income groups — Sandra on social assistance, Anna the pensioner, Jasper the school leaver — the relative improvement is greatest.
This is not a plea for a specific party. It is a numerical observation: the choice between the current Brussels model and a nature-adapted Brussels model is for the Dutch voter a choice with a concrete price. Per household, per year, in euros that become directly visible on the bank statement.
Methodology and sources
This piece builds on the three-step model of Silent Analysis III, with an added BiCRS layer and a separate ethanol analysis.
BiCRS layer — first analysis
Per scenario per party a BiCRS benefit was calculated according to the formula: base_benefit × pressure_multiplier × scenario_sensitivity × cycle_year. Base_benefit (€1,500/year) represents the average household benefit from the removal of Green Deal + CBAM pass-through in 2030. Pressure_multiplier (1 + pressure_index/15) accounts for the fact that parties with higher pressure index would have caused more climate costs — and BiCRS therefore removes more of that. Scenario_sensitivity varies between 1.3 (pensioner, mainly energy bill) and 2.4 (automotive supplier, everything benefits).
Anchor: The Brussels Consequence Map-BiCRS calculated EU-wide costs of the Green Deal package at 3.5–4% EU-GDP/year and CBAM at 0.7–1% EU-GDP/year in 2030. For the Netherlands prorated on share of EU-GDP and household count: average €5,180 climate cost per household, of which €3,500 removable through BiCRS implementation.
Ethanol analysis — second analysis
Per household type, heating costs and mobility costs were calculated under three tracks:
- Current track: natural gas €1.42/m³ × consumption + petrol €1.78/litre × (km/15)
- Government track: heat pump (electricity × 2.78 kWh/m³-equivalent + investment depreciation) + electric car (0.18 kWh/km × electricity price + price premium depreciation) + hidden wind/solar costs €1,135/year/household
- Ethanol track: micro-CHP (1.7 litres ethanol per m³ gas-equivalent × €0.55/litre + investment depreciation) + ethanol car (1 litre per 11 km × €0.55) + micro-CHP depreciation €233/year
Hidden wind/solar costs consist of six items: SDE++ subsidy €380, grid expansion €220, grid batteries €95, backup gas power plants €130, fifteen-year replacement cycle €165, recycling and decommissioning €145. Sources: PBL Climate and Energy Outlook 2025, TenneT Investment Plan 2026–2035, Eurostat ETS data 2026, and specialised studies on Li-ion recycling (JRC 2023) and composite wind turbine blades (WindEurope 2024).
Hydrogen analysis — third analysis
Per household type, hydrogen heat and hydrogen mobility were calculated under the assumption of €12/kg delivery price (BloombergNEF 2024, midpoint). Conversion per m³ natural gas equivalent: 0.305 kg H₂ (based on 35 MJ/m³ gas, 120 MJ/kg H₂, boiler efficiency 88 percent for H₂ versus 92 percent for gas).
Fuel cell mobility: 1 kg H₂ per 100 km, based on Toyota Mirai and Hyundai Nexo real-world measurements. Hidden infrastructure costs based on eight items from the Climate Agreement, Gasunie investment plan 2025–2035, SDE++ rates green hydrogen RVO 2024, and specialised studies on hydrogen embrittlement of steel (TNO 2022) and fuel cell recycling (JRC Joint Research Centre 2024).
Chain efficiency according to IEA Global Hydrogen Review 2024: electrolysis 75% (current state of the art alkaline and PEM), compression to 700 bar 90%, transport via converted pipe 95%, end use via boiler 88%. Cumulative: 56% heat efficiency from primary electricity — versus 280% via heat pump (COP 3.5) and 88% via ethanol chain.
Limitation and invitation
All three models have been kept intentionally transparent. The Python files scenarios_NL_BiCRS.py, scenarios_NL_ethanol.py, and scenarios_NL_waterstof.py will be made available on gevolgenkaart.nl once the platform goes live. Anyone who disputes the accuracy of the figures can reproduce the calculations.
What this piece is not. Not a prediction — policy outcomes depend on implementation and context. Not a call to any party — the figures speak for themselves. Not an attack on wind or solar energy as a technology — they remain useful in the mix, but not as the backbone of the Dutch energy transition.
What this piece is. The question of whether there is a cheaper, cleaner, and fairer path than the current government track. The answer, model-based and on the basis of figures verifiable by anyone, is yes. Two paths even — separate from each other, each standing on its own.
WRITTEN BY JACOBUS VAN MERKSTEIJN WITH EDITORIAL AI SUPPORT
HET OPEN VIZIER · OPENVIZIER.ORG · JUNE 2026