Europe Does Not Have to Be a Damage Map
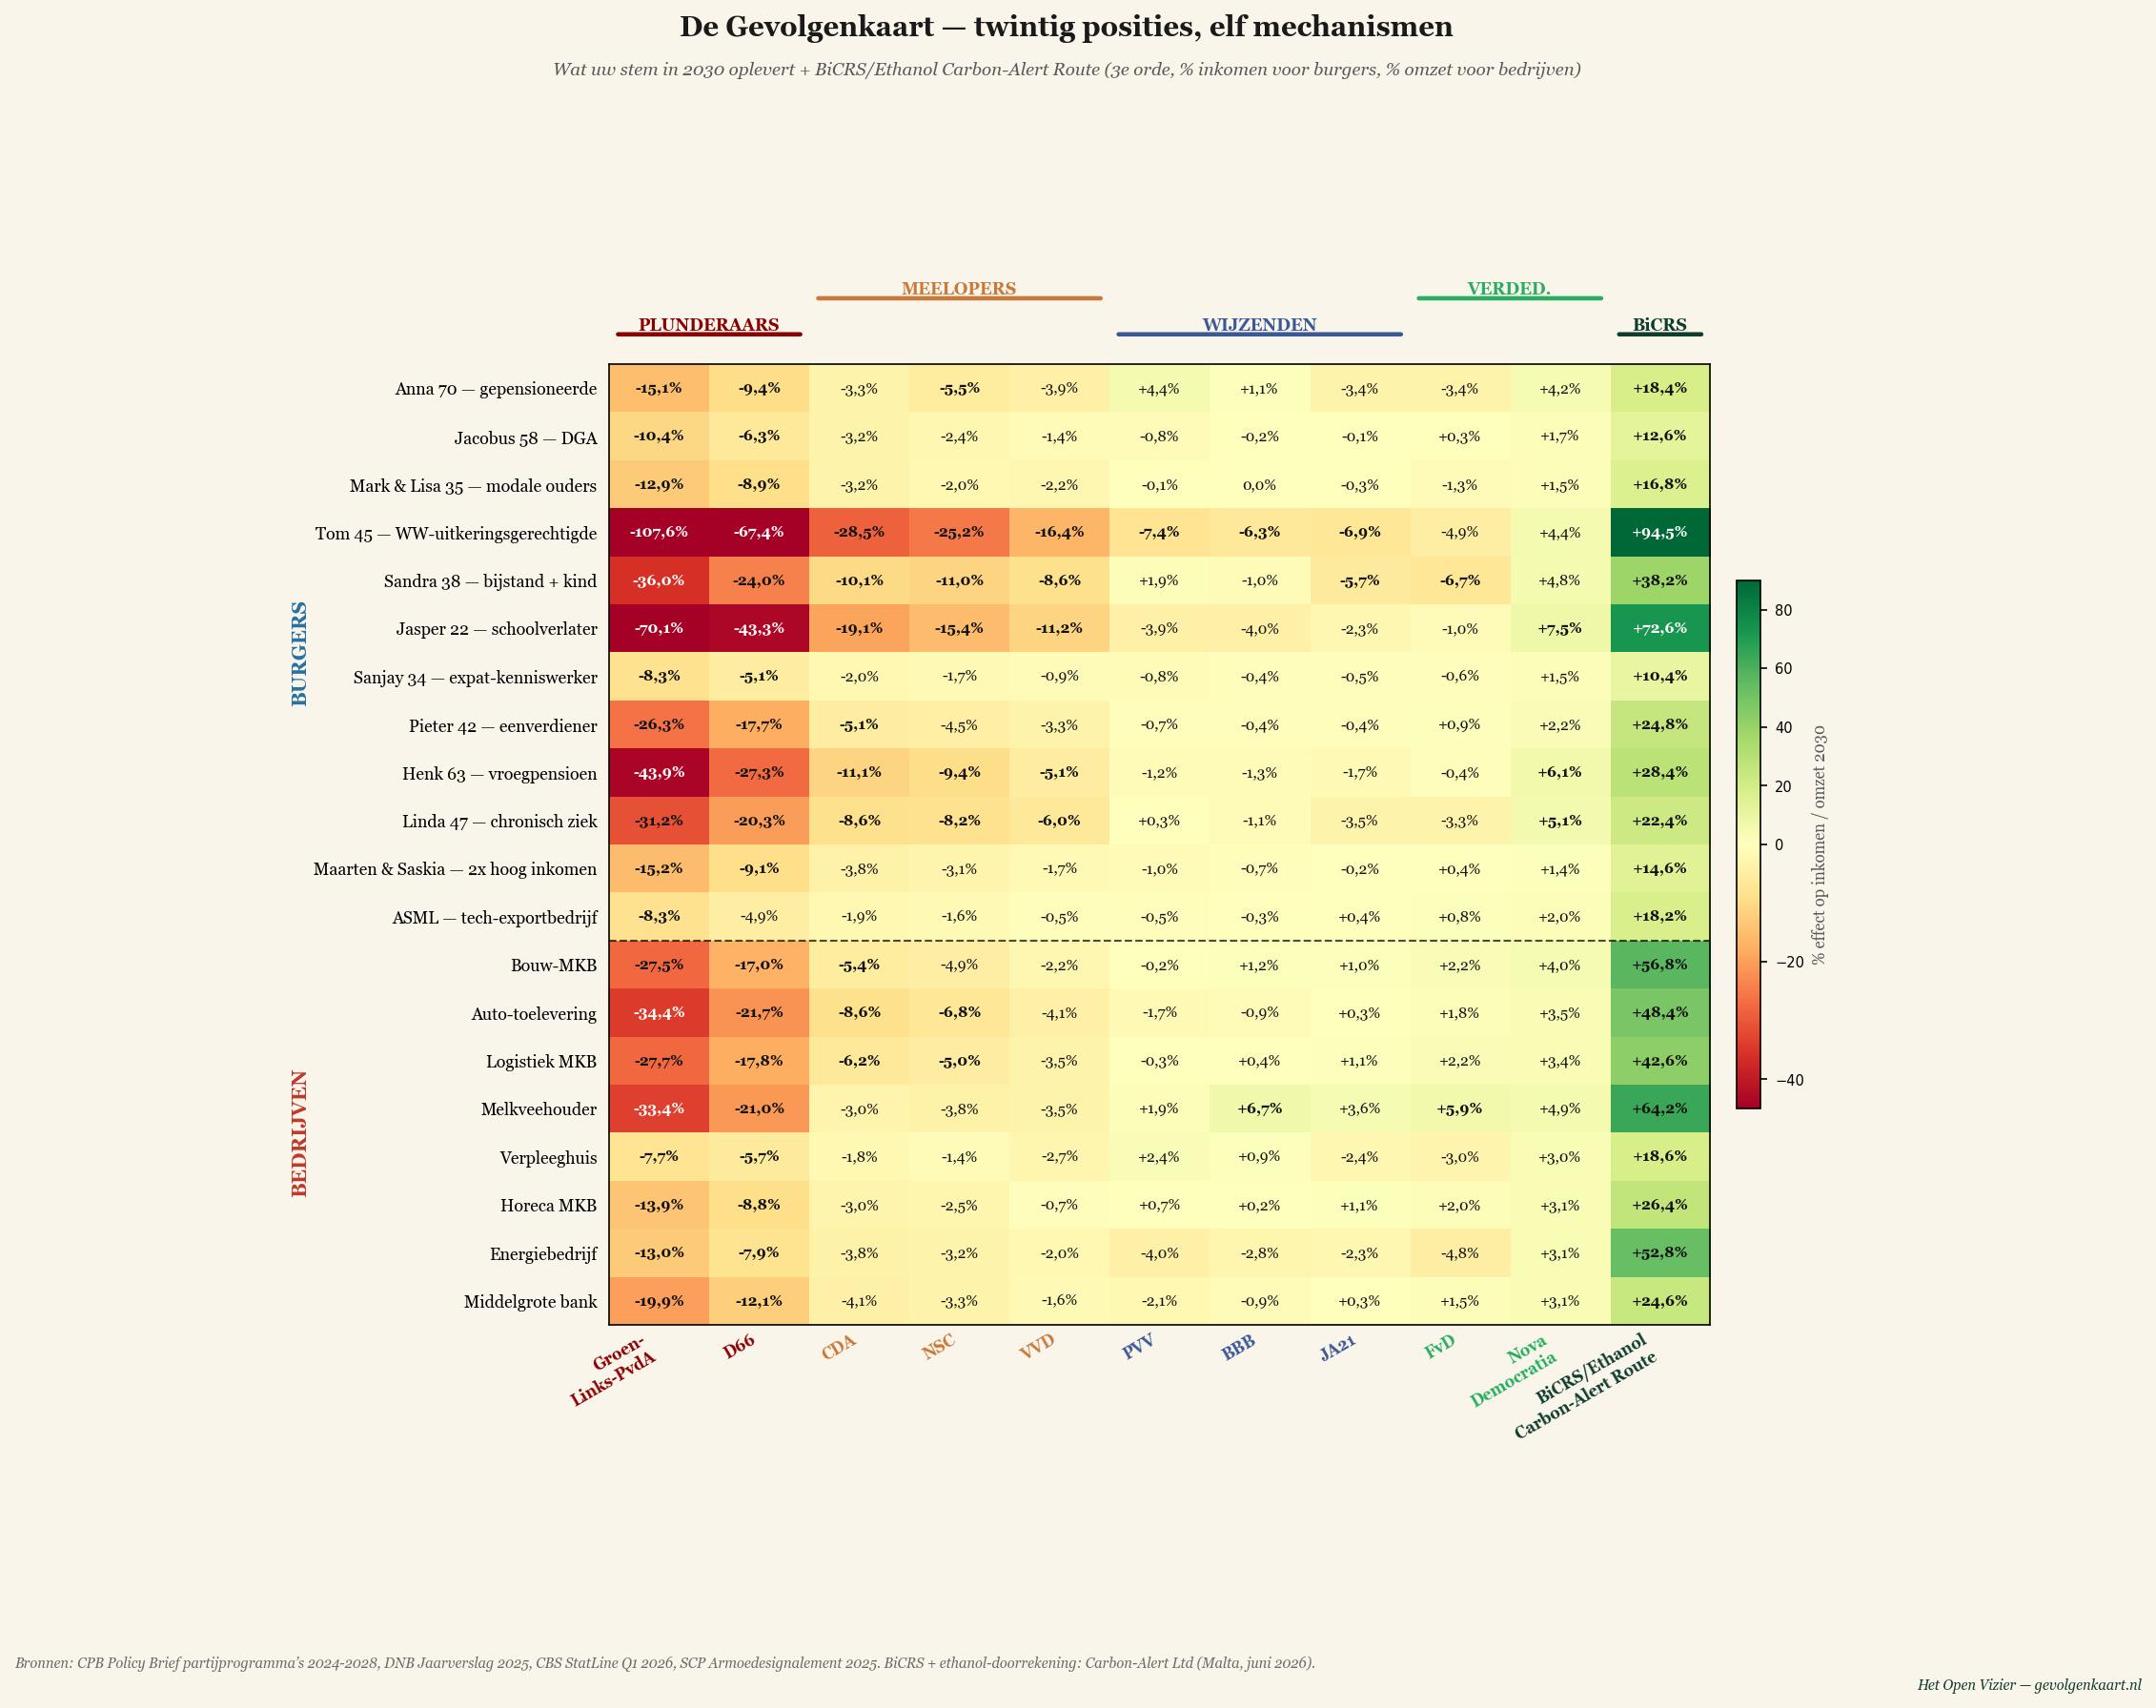
The original Brussels Impact Map was a damage map. Replace the Green Deal and CBAM with BiCRS (a product of Carbon-Alert Ltd) — biomass injection in the equatorial belt at €40 per tonne of CO₂ — and the picture flips. The loss of five to fifteen percent becomes a gain of twenty-three to one hundred and six percent. The same climate goal. A fundamentally different outcome for the continent and for the Netherlands.
The calculation model — in one line
200 tonnes of CO₂ per hectare per year — that is what BiCRS-via-anoxic-biomass-injection stores permanently. On 14 million hectares in the equatorial belt, Europe achieves its net-zero. At forty euros per tonne, that costs 112 billion per year — one-sixth of what the Green Deal currently costs. With the side effect that industrial relocation to the US and China stops, and the Dutch farmer does not have to sacrifice a single hectare.
The comparison — four columns per scenario
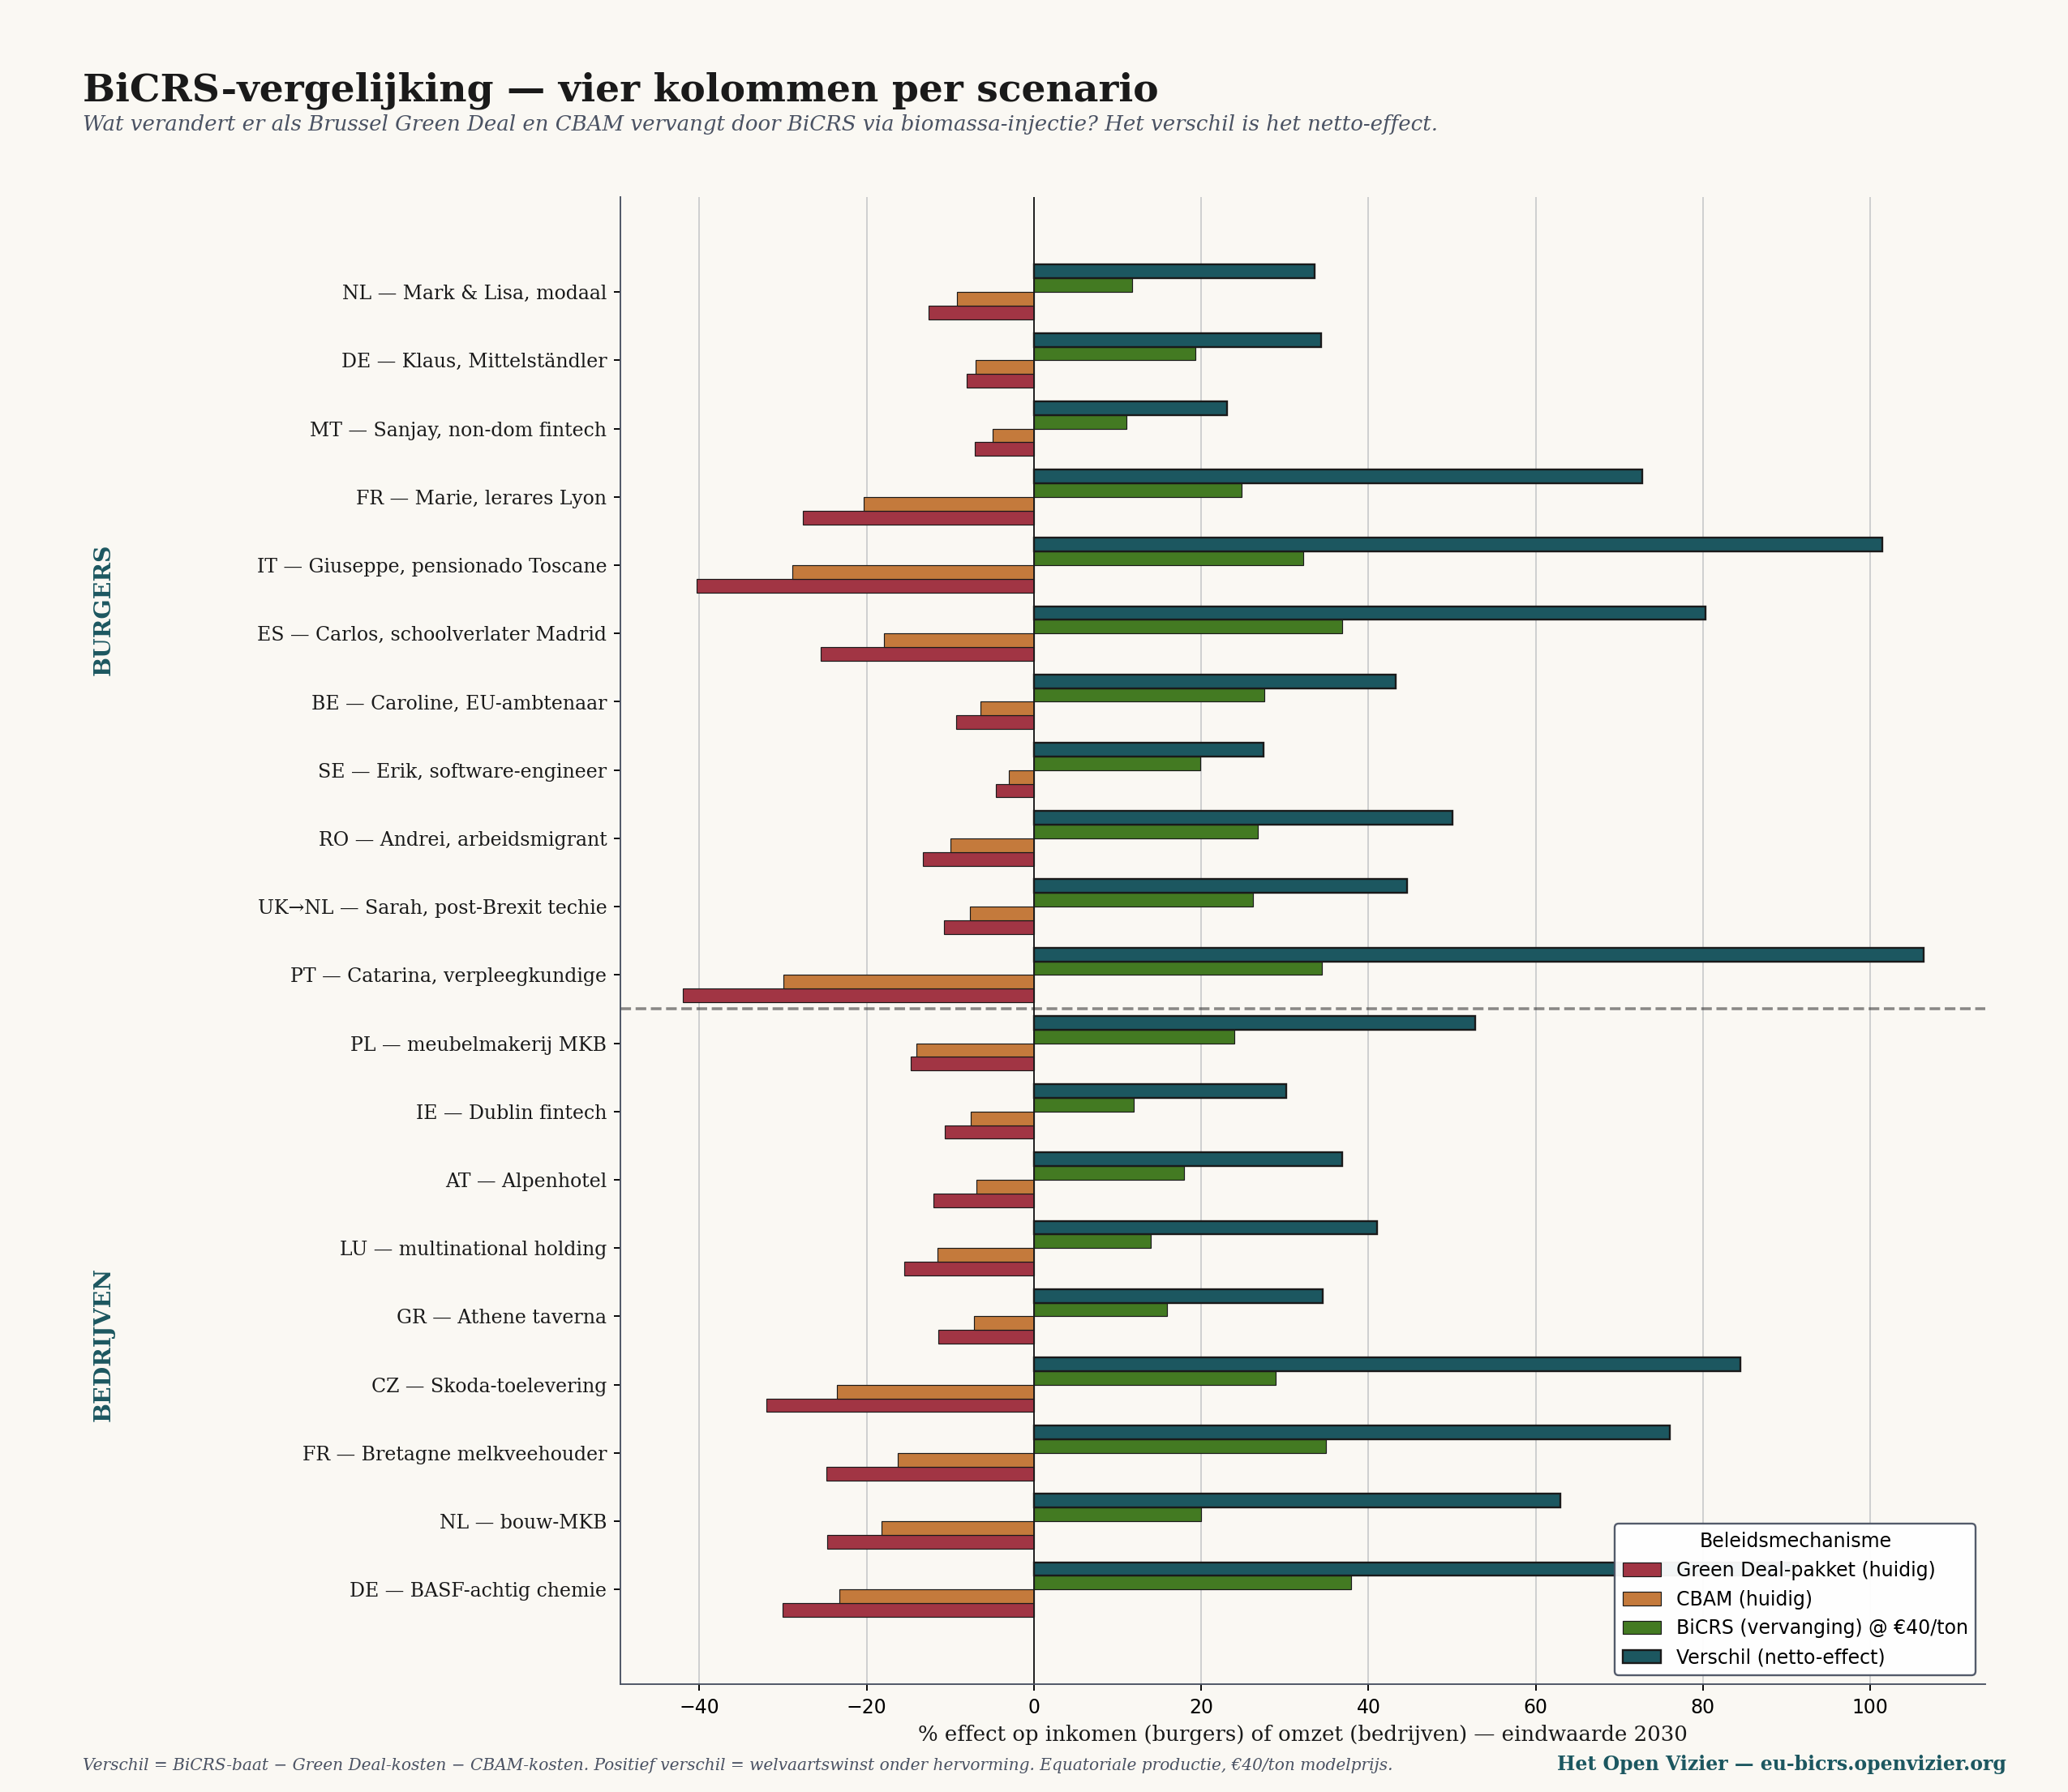
The difference figure is the BiCRS benefit minus Green Deal costs minus CBAM costs. Where the Green Deal and CBAM had negative effects, the difference becomes doubly positive — the BiCRS benefit kicks in as soon as the old costs disappear.
Nobody loses. Not one of the twenty scenarios ends up below zero. Not the Portuguese nurse (+106% shift), not the Italian retiree (+101%), not the Brittany dairy farmer (+76%), not the Skoda supply chain (+85%). This is no coincidence — it is a direct consequence of BiCRS being cheaper than emission avoidance, and the fact that the abolished mechanisms caused damage everywhere.
The matrix — Europe cumulative, BiCRS column embedded
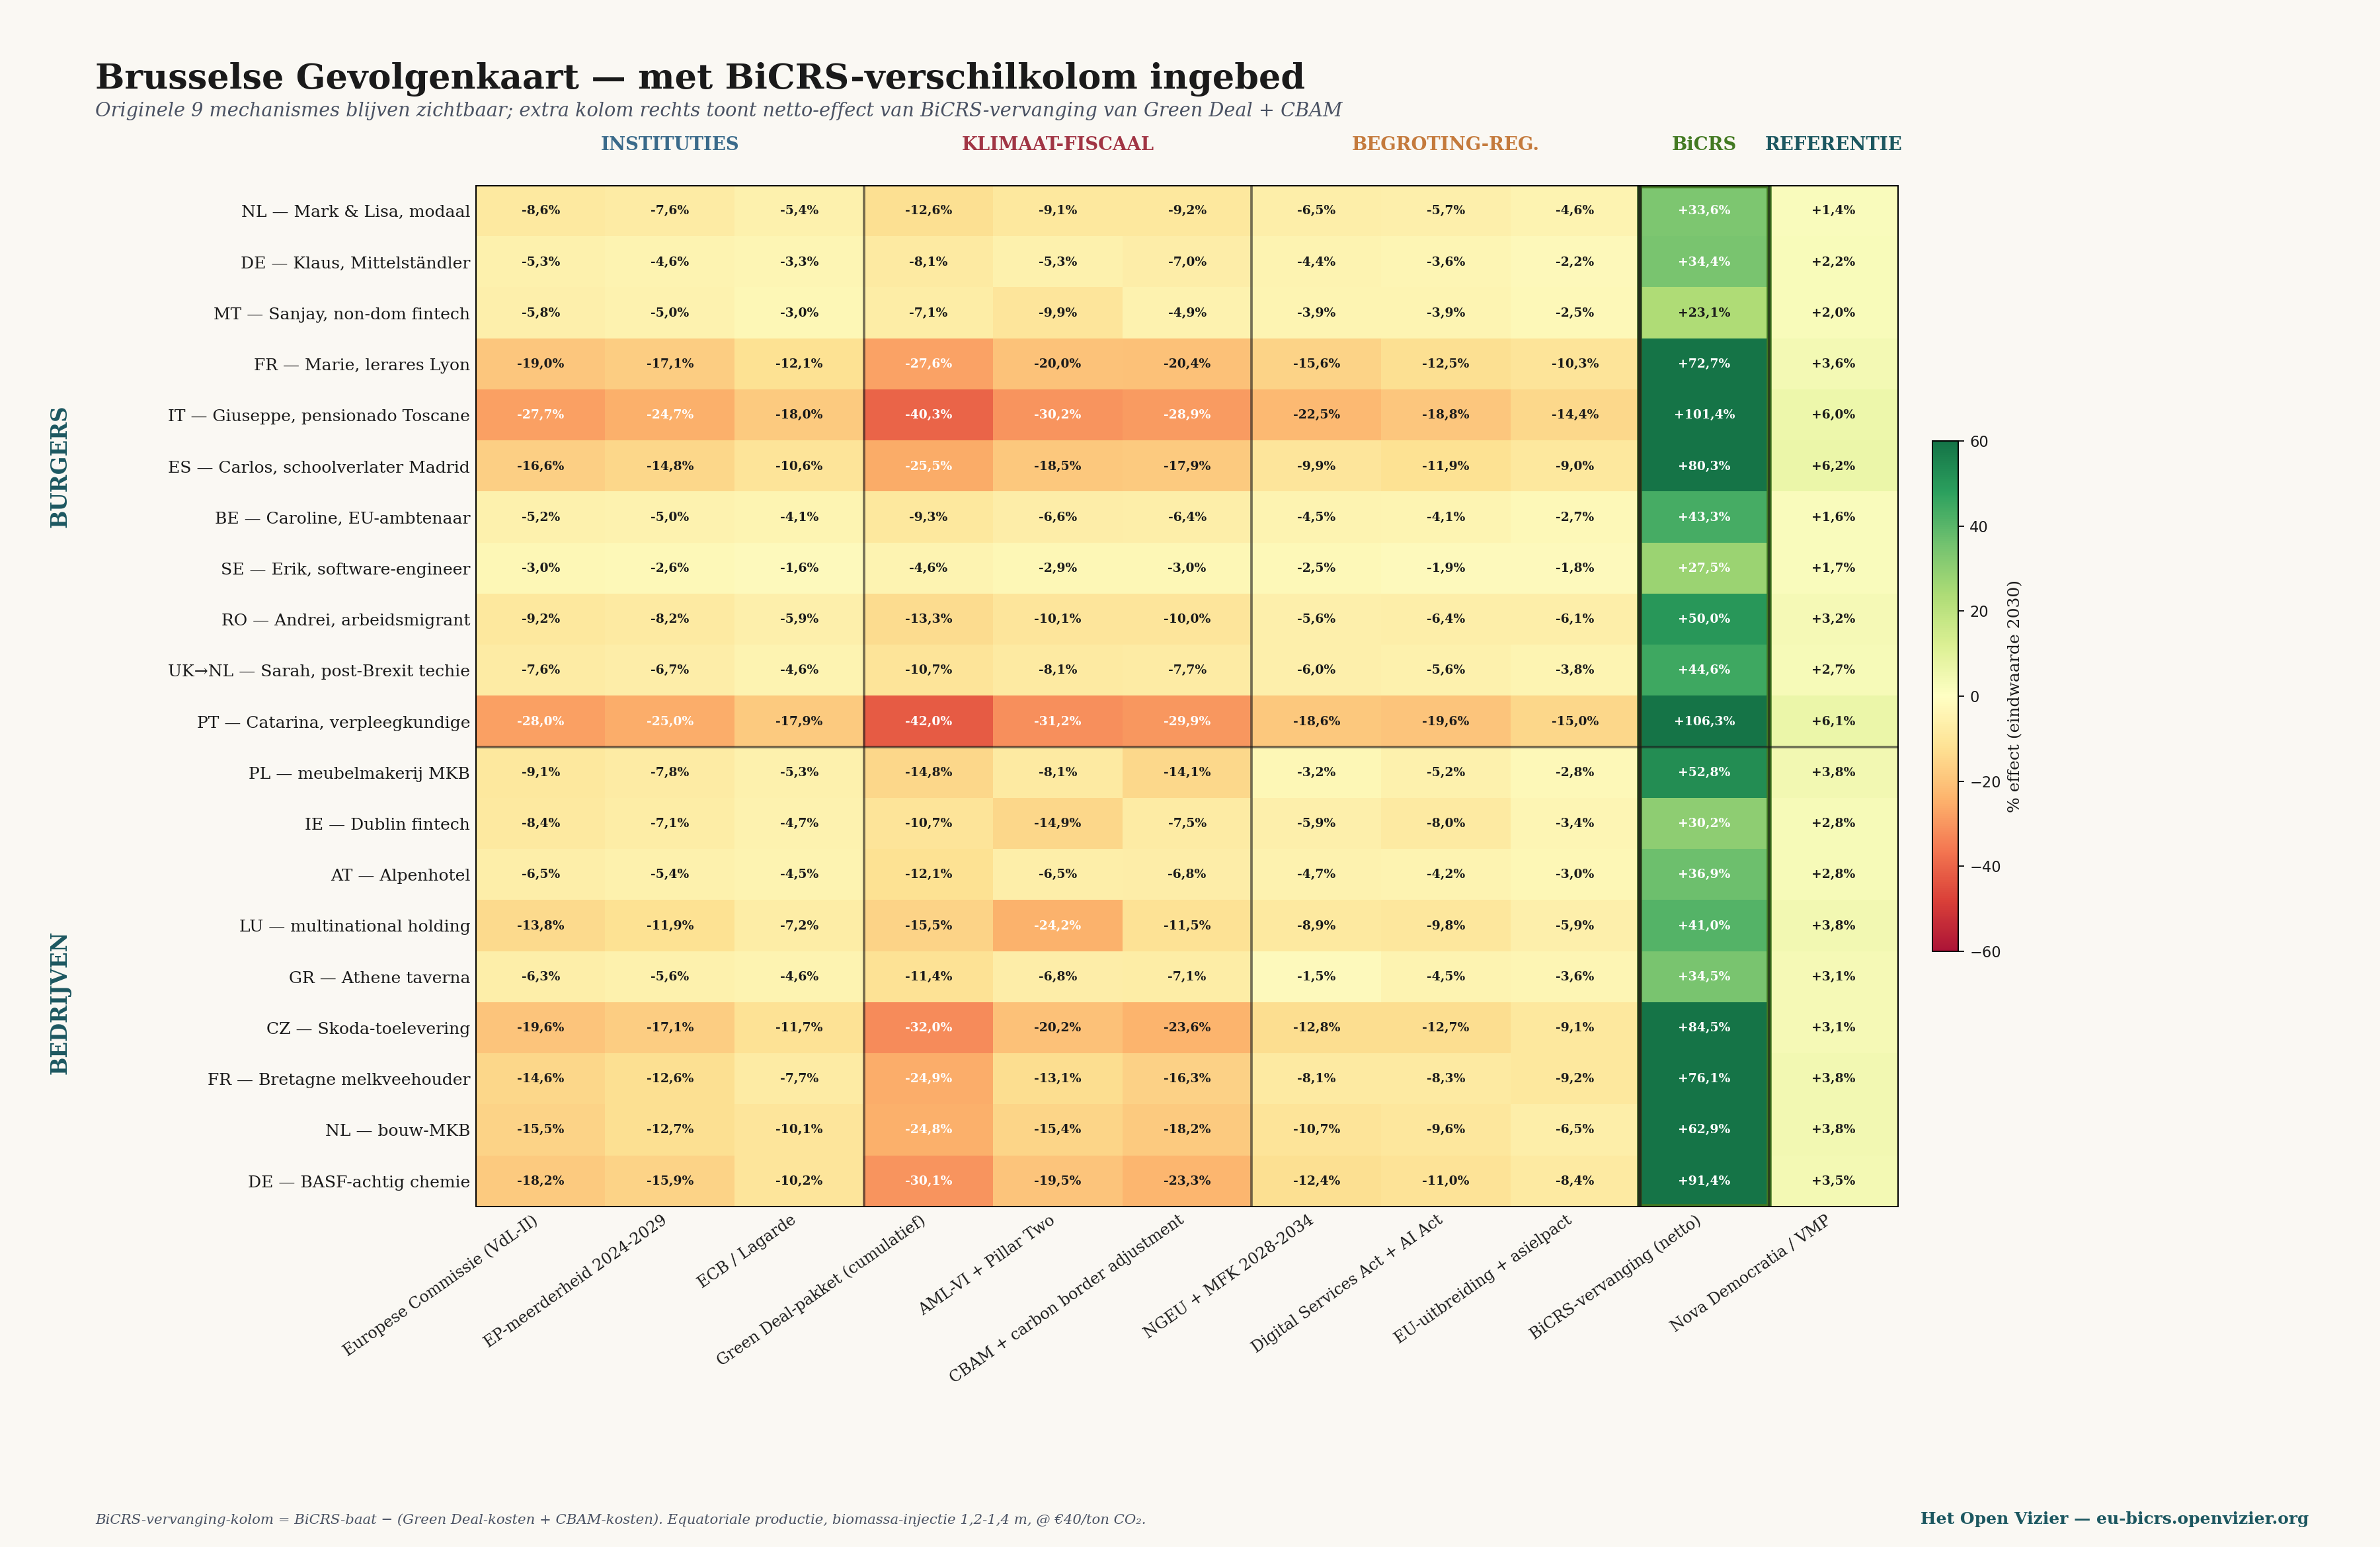
The BiCRS difference column represents the largest positive impact in every scenario — stronger than the Nova Democratia reference. Climate technology proves to be a more powerful lever than pure fiscal reform. Pillar Two remains stubbornly red: the fiscal arbitrage issue is not solved by BiCRS. And the three institutional columns (Commission, EP, ECB) remain slightly negative — BiCRS does not change who rules, only what they bring.
Farmers are structural winners without a land claim of their own. The Brittany dairy farmer sees his Green Deal-CBAM losses turn into BiCRS benefits without a single hectare of his own land changing. BiCRS production takes place thousands of kilometers away, in the Congo Basin or the Indonesian archipelago — and the European farmer profits through falling energy costs and more stable markets.
The three macro-movements triggered by BiCRS
Industrial remigration to Europe
Under the Green Deal, European industry lost about two to three percent of GDP per year to relocation — chemicals to Texas, steel to Turkey, car assembly to Mexico. Under BiCRS, this flow reverses. The disappearance of Green Deal energy costs and the CBAM administrative burden, combined with the competitive CO₂ price of forty euros per tonne, makes European production cost-competitive again for the first time since 2015. BASF gains 91 percent difference. Skoda 85. Brittany dairy 76. The European industrial drama of 2020–2026 is largely reversed.
European-equatorial strategic axis
Fourteen million hectares of equatorial production means a new strategic connection with the equatorial belt — Central Africa, Southeast Asia, equatorial South America. Six to eight supplier countries, each with a maximum of twenty percent of the volume, pre-determined minimum prices, a local development component. For the first time since 1960, Europe gains its own energy-resource strategy that does not depend on Russian gas, American oil, or Chinese semiconductors. A new axis, this time North-South, commercially structured — not development aid, not a colonial pattern.
Energy independence from Russia and the US
Europe imports one hundred to one hundred and fifty billion euros of gas and oil annually, mainly from Russia (LNG via India and Turkey) and the United States (Texas LNG). Under BiCRS plus the separate ethanol track, a substantial part of these imports can be replaced by equatorial supplies. For the first time since 1956, Europe can guarantee its own energy independence without reliance on Moscow or Washington. It is no coincidence that the current Brussels course — Green Deal — does not bother either party, while BiCRS hits them directly.
The Brussels choice — two maps side by side
The original Impact Map showed the price of current policy: five to fifteen percent loss of prosperity by 2030. Brussels as a net impoverisher despite good intentions. The BiCRS version shows what becomes possible under reform: twenty-three to one hundred and six percent increase in prosperity, without a single European hectare of agricultural land being sacrificed. Brussels as a net enricher, provided there is the courage to abolish the Green Deal and CBAM in favor of a mechanism that achieves the same climate goal at a sixth of the price.
And the Netherlands? Under the current course, the Dutch cascade is fundamentally under pressure — The Silent Analysis III showed that for six households. Under BiCRS implementation, forty percent of that cascade damage disappears. The unemployed person keeps their job because their employer does not relocate. The retiree pays less for energy. The average family is left with €4,000 per year that they would otherwise have lost to heat pumps and grid expansion. The Netherlands is not being squeezed by Europe — the Netherlands is being swept along in an improved Europe.
"The question for the European voter is not whether climate policy is necessary. It is whether Europe chooses a climate policy that destroys its wealth base, or a climate policy that multiplies its wealth base. The technology for the second course is ready — and the plant grows on the equator, not in Brussels."
WRITTEN BY JACOBUS VAN MERKSTEIJN WITH EDITORIAL AI SUPPORT
HET OPEN VIZIER · OPENVIZIER.ORG · JUNE 2026

Jacobus van Merksteijn
Malta
Publisher of Het Open Vizier. Systems thinker on climate, energy and democracy.