Where the Brussels Consequence Map mapped the hidden stacking of EU policy, and the Swiss version did the same for Bern, the Singaporean Consequence Map asks how a small, highly developed city-state stacks its own choices. Singapore's policy stack is exceptionally readable — every mechanism is documented in MOF budget statements, CPF announcements, MAS quarterly reports and HDB framework documents. The third-order stacking, however, is rarely shown in a single frame.
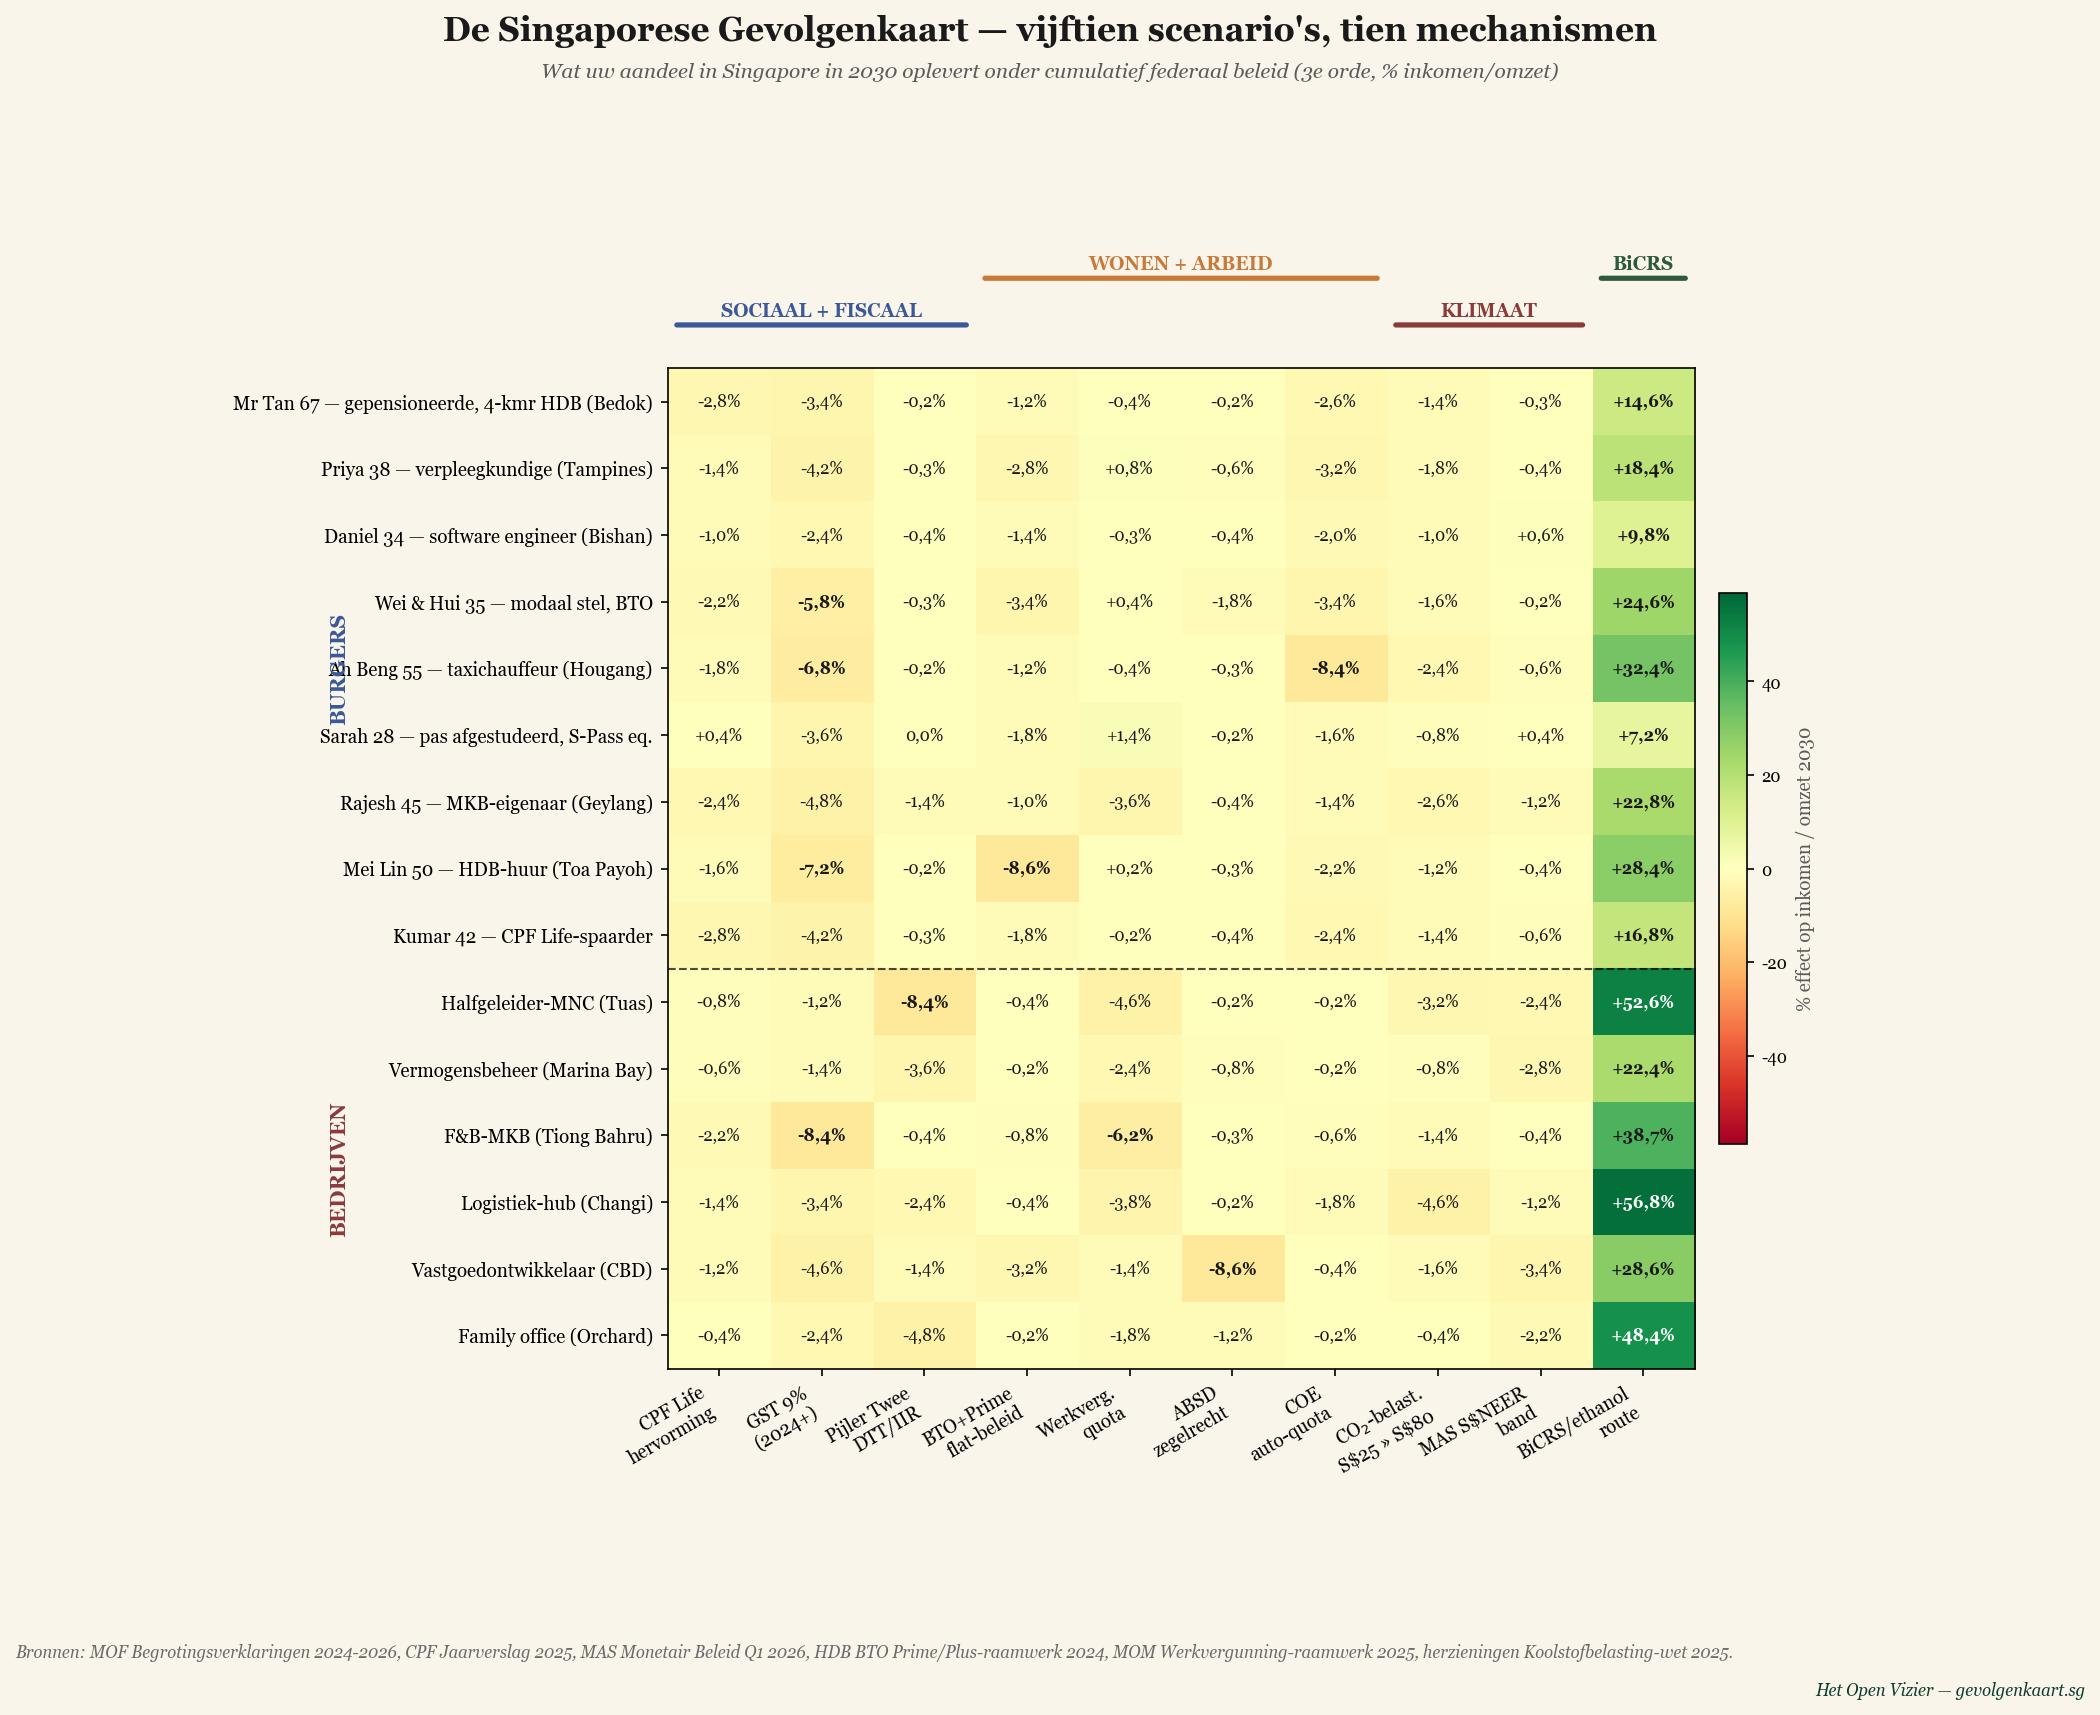
This map plots fifteen Singaporean scenarios against ten federal mechanisms in force in 2026. Each cell is the % effect on income (individuals) or revenue (businesses) by 2030 under cumulative policy. Read column by column to see what each lever does. Read row by row to see what one life or business absorbs.
What the map shows
Each row is a Singaporean scenario — from Mr Tan, the 67-year-old retiree in a 4-room HDB flat in Bedok, via Daniel the software engineer in Bishan, to a semiconductor multinational in Tuas. Each column is one federal mechanism, from CPF Life reform via the GST 9% increase, Pillar Two for multinationals, the BTO + Prime/Plus flat regime, work-permit quotas, ABSD, COE, the carbon-tax progression and the MAS S$NEER band. The rightmost column is an alternative MOF reference — what the same scenarios would yield under a more SME-friendly, more affordability-anchored course.
The ten mechanisms
Social + fiscal
- CPF Life reform — the 2024–2026 adjustments to the Basic Retirement Sum, Full Retirement Sum and the payout profile of the CPF Life Escalating Plan.
- GST 9% (2024+) — the GST increase from 7% to 8% in 2023 and to 9% in 2024, with compensation via the Assurance Package.
- Pillar Two DTT/IIR — Singapore's Domestic Top-up Tax and Income Inclusion Rule for large multinationals, in force from 2025.
Housing + labour
- BTO + Prime flat policy — the 2024 BTO classification framework with Prime, Plus and Standard categories, MOP rules and subsidy clawback.
- Work-permit quotas — MOM's tightening of S-Pass, Work Permit and EP quotas across sectors.
- ABSD stamp duty — Additional Buyer's Stamp Duty for second/third homes and foreign buyers.
- COE vehicle quota — Certificate of Entitlement quota system for vehicle ownership.
Climate + monetary
- Carbon tax S$25→S$80 — the carbon-tax progression from S$25/tonne (2024) to S$45 (2026–27) and S$50–80 (2030).
- MAS S$NEER band — the Monetary Authority of Singapore's nominal effective exchange-rate policy, currently on a modest appreciation path.
BiCRS/ethanol route
- BiCRS/ethanol route — what the same scenarios would yield under replacement of the carbon tax and LNG import subsidies with BiCRS (biomass injection in the equatorial belt, directly adjacent to Singapore) plus ethanol as motor fuel. Singapore is energy-import-dependent; BiCRS adoption drastically decompresses import-cost and carbon-tax pressure. Heavy industry, semiconductor MNCs and logistics hubs benefit disproportionately; households via lower energy and transport costs.
The fifteen scenarios
Individuals (nine)
Mr Tan 67 — retiree, 4-room HDB (Bedok)
CPF Life monthly payout, paid-off HDB, modest savings. GST 9% and COE the largest absolute drags.
Priya 38 — nurse (Tampines)
Public hospital, single mother. GST + COE + work-permit quotas compound; reference rate the biggest plus.
Daniel 34 — software engineer (Bishan)
Above-average income, condo tenant, partial SRS saver. MAS band a minor plus; GST + COE the main drags.
Wei & Hui 35 — median couple, BTO
Newly collected BTO in Tampines, dual-income. GST + BTO+Prime + COE stack to a real loss.
Ah Beng 55 — taxi driver (Hougang)
Self-employed, COE-dependent. The COE column alone is decisive.
Sarah 28 — fresh graduate, S-Pass eq.
Recent local graduate competing with sectoral S-Pass restrictions. Work-permit quotas a minor plus.
Rajesh 45 — SME owner (Geylang)
F&B SME, family-run. Work-permit quotas + carbon tax + GST compound; reference rate relieves the most.
Mei Lin 50 — HDB rental (Toa Payoh)
HDB tenant. GST + BTO+Prime are the largest losses; without the Assurance Package this would be sharper.
Kumar 42 — CPF Life saver
Maximum CPF Special + 3a SRS. CPF Life reform a meaningful drag; reference rate the strongest counterweight.
Businesses (six)
Semiconductor MNC (Tuas)
Pillar Two biggest factor; work-permit quotas significant; reference rate strongest plus.
Wealth management (Marina Bay)
Private banking. Pillar Two and MAS S$NEER band biggest factors; reference rate a compensation.
F&B SME (Tiong Bahru)
Small restaurant. GST 9% (limited pass-through) + work-permit quotas + BTO labour pressure compound.
Logistics hub (Changi)
Freight forwarder, EU + Asia clients. Carbon tax and work-permit quotas biggest drags.
Property developer (CBD)
ABSD on bulk-purchase projects + BTO+Prime competition biggest factors.
Family office (Orchard)
Single-family office. Pillar Two + MAS band; reference rate a clear plus.
How to read the numbers
These are third-order modelled effects — direct costs, behavioural adjustment, secondary equilibrium — under cumulative policy. They are not predictions. They are compiled from MOF budget statements 2024–2026, CPF Annual Reports, MAS quarterly reports, HDB BTO Prime/Plus framework documents (2024), MOM Work Permit framework (2025), and the carbon-tax legislation revisions (2025).
What the map does show is which scenarios are net winners and which are net losers under cumulative Singaporean federal policy as it stands in mid-2026 — and what exit the BiCRS/ethanol route offers: a consistently positive effect across all fifteen scenarios, from +7% for the fresh graduate to +57% for the logistics hub in Changi.
Singapore's policy stack is the most readable in this series. The stacking is, however, the same as everywhere else: a citizen or business reads each policy individually and finds it manageable. Read together — as the map does — the picture changes. And the BiCRS/ethanol route, fed from the equatorial belt that literally borders Singapore, shows that there is a way out that works for everyone.
What follows
The Singaporean Consequence Map is published in parallel with the Swiss Consequence Map. Both are first iterations of a methodology that travels well: take a documented policy stack, plot fifteen to twenty representative scenarios against ten to twelve mechanisms, model third-order stacking, and compare with an alternative course.
The goal is not to predict anyone's 2030 outcome. The goal is to place cumulative policy in a single readable frame, before the budgets and elections that decide it.