Where the Brussels Consequence Map posed one question to twenty European scenarios — what does cumulative EU policy cost you by 2030? — the Swiss version poses the same question to fifteen Swiss scenarios, but the mechanisms are different. Switzerland has its own policy stack — and on 2 March 2026, the Federal Council signed Bilaterals III in Brussels, the most important treaty Bern has ratified since 1999.
This map plots fifteen lives and businesses against ten federal mechanisms in force or being phased out in 2026. The values are third-order effects — meaning each policy is read together with the others, not in isolation. Direct costs, behavioural response, secondary equilibrium. A number you can read.
What the map shows
Read horizontally: each row is one Swiss scenario, from Hans the Zurich retiree to a multinational headquartered in Zug. Read vertically: each column is one federal mechanism, from AHV/BVG reform via Bilaterals III to the SNB's interest-rate climate. The rightmost column shows an alternative reference — what the same scenario would yield under a different federal course.
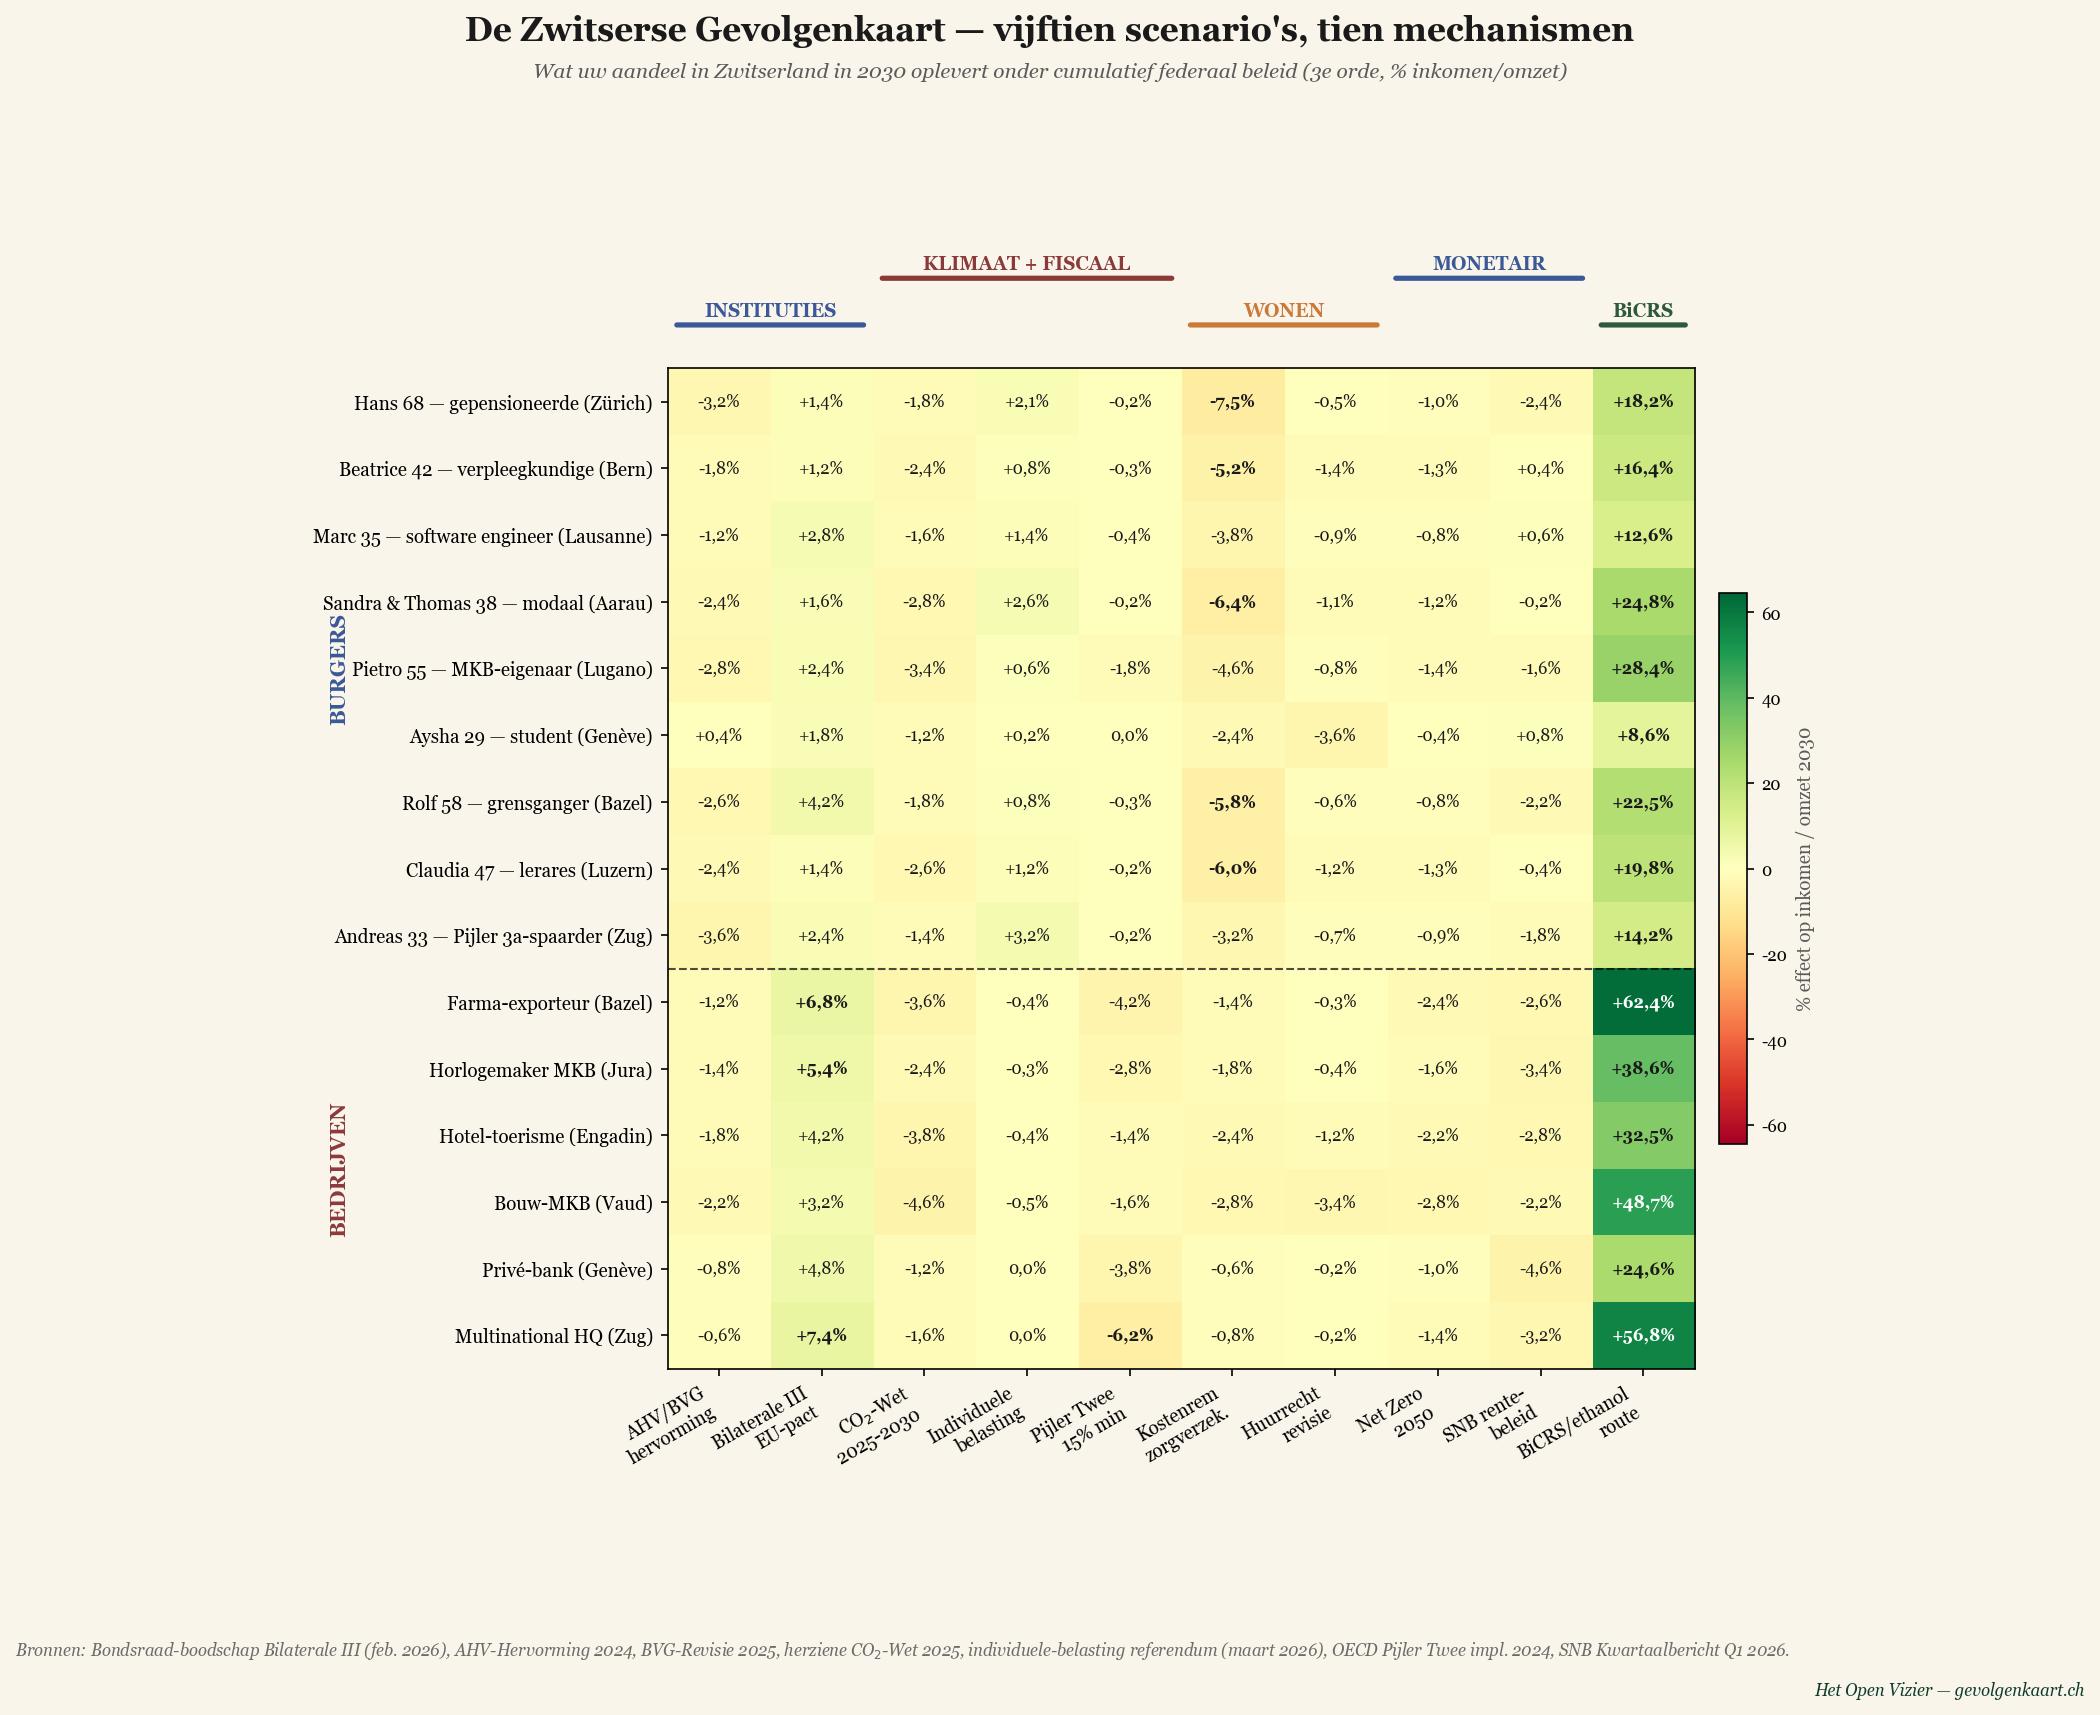
The ten mechanisms
Social + institutions
- AHV/BVG reform — the 2024 AHV revision and the 2025 BVG update, with higher premiums and adjusted conversion rates for occupational pensions.
- Bilaterals III (EU pact) — the Bilaterals III package signed in Brussels on 2 March 2026, restoring full market access and dynamic alignment in seven core areas.
Climate + fiscal
- CO₂ Act 2025–2030 — the revised federal CO₂ Act, with increased CHF/tonne levies on fossil fuels and introduction of border corrections.
- Individual taxation — the 2026 referendum decision to abolish joint spousal taxation at federal, cantonal and municipal level.
- Pillar Two 15% minimum — Switzerland's domestic top-up tax for large multinationals, introduced in 2024 in line with the OECD agreement.
Housing + health
- Cost Brake (health insurance) — the federal cost-brake initiative limiting premium growth, with structural consequences for hospitals and supplementary insurers.
- Tenancy law revision — the federal tenancy-law revision tightening rent controls in shortage zones.
Climate + monetary
- Net Zero 2050 — the federal climate protection act ratified by referendum in 2023, with binding sectoral targets.
- SNB interest-rate policy — the Swiss National Bank's stance on negative rates, franc strength and capital flows.
BiCRS/ethanol route
- BiCRS/ethanol route — what the same scenarios would yield under replacement of the CO₂ Act and Net Zero routes with the BiCRS strategy (biomass injection + ethanol as motor fuel). Swiss dependence on German and Italian industrial supply is relieved because the €40/tonne CO₂ model price closes the entire cascade. Pharma, watches and heavy industry benefit disproportionately; retirees and construction modestly via lower energy costs.
The fifteen scenarios
Individuals (nine)
Hans 68 — retiree (Zurich)
Dependent on AHV + BVG, modest 3a savings, owner of apartment. Cost Brake hits him hardest as supplementary insurance is repriced.
Beatrice 42 — nurse (Bern)
Cantonal hospital staff, single, tenant. CO₂ Act + Cost Brake compound; Bilaterals III brings a small boost.
Marc 35 — software engineer (Lausanne)
Above-average salary, mobile, partial 3a maximiser. Bilaterals III a clear plus; AHV reform a moderate drag.
Sandra & Thomas 38 — median (Aarau)
Dual-income, two children, mortgage. Cost Brake + CO₂ + AHV stack to a meaningful net loss.
Pietro 55 — SME owner (Lugano)
Ticino small business, cross-border exposure. CO₂ Act bites; Bilaterals III is the relief valve.
Aysha 29 — student (Geneva)
PhD candidate, partial rental subsidy. Tenancy law revision is the biggest direct effect.
Rolf 58 — cross-border commuter (Basel)
Cross-border commuter from Lörrach. Bilaterals III decisive; Cost Brake the second factor.
Claudia 47 — teacher (Lucerne)
Cantonal civil servant. Cost Brake + CO₂ + AHV compound. Steady improvement under alternative.
Andreas 33 — Pillar 3a saver (Zug)
Maximum 3a, employed in tech. Individual taxation lifts the joint-spouse penalty; AHV reform partially offsets.
Businesses (six)
Pharma exporter (Basel)
Large pharma, mostly EU + US revenue. Bilaterals III a large plus; Pillar Two and Net Zero compound.
Watch SME (Jura)
Mid-market watches, EU + Asia. Bilaterals III restores import-export ease; SNB rate the biggest drag.
Hotel-tourism (Engadin)
Alpine resort, mostly EU guests. Bilaterals III brings relief on freedom of movement.
Construction SME (Vaud)
Cantonal builder, tight labour market. CO₂ + tenancy law revision squeeze margins.
Private bank (Geneva)
Wealth management. SNB interest-rate policy + Pillar Two biggest factors; Bilaterals III a modest plus.
Multinational HQ (Zug)
European HQ of US/Asian multinational. Pillar Two costly; Bilaterals III the strongest counterweight.
How to read the numbers
The numbers are not predictions. They are derived from federal impact reports, AHV/BVG actuarial files, OECD Pillar Two implementation tracking, and the Federal Council message on Bilaterals III (February 2026). They are presented as if each mechanism reaches its 2030 end-state and stacks with the others. In practice, individual outcomes will vary. The map is a structure, not a prediction.
What the map does clearly show is which scenarios are net winners and which are net losers under cumulative Swiss federal policy as it stands in mid-2026 — and what exit the BiCRS/ethanol route offers: a consistently positive effect across all fifteen scenarios, from +8% for the student to +62% for the pharma exporter in Basel.
The Brussels Consequence Map showed twenty European scenarios losing more than they could absorb. The Swiss version shows a smaller country with a different policy stack — but where the same stacking logic applies. Bilaterals III is the first positive lever; the BiCRS/ethanol route is the second, and it works for everyone, not only for cross-border commuters and exporters. Read the last column.
What follows
This Swiss Consequence Map is the first in a series extending beyond the EU. A Singaporean Consequence Map follows in the same publication (published simultaneously). The methodology — fifteen to twenty scenarios × ten to twelve mechanisms × third-order stacking — travels well to any jurisdiction where the policy stack is sufficiently documented and stable to model.
The goal is not to map every country. The goal is to make the cumulative consequences of policy visible, scenario by scenario, before the elections that decide them.