
Guide to reading
This document distinguishes between two types of statements: source-based facts and calculations (M), and conditional scenarios and forecasts (S). For the charts, the source data, the calculation performed and the interpretation that constitutes a scenario are explained separately.
- Measured (M): source-based figures, reported events and transparent calculations using those data, with a source number in square brackets.
- Scenario (S): conditional projections, timelines and qualitative directional forecasts; the assumptions and the meaning of the graphical representation are included.
For productive capacity, the article uses the concepts from the Open Vizier framework: PBW, NTPK and NEPK. The previously calculated Dutch values are PBW 2024 € 709 billion, 62.9% of GDP; NTPK approximately 5.2% of GDP; and NEPK approximately 3%. These Dutch reference values have not been recalculated here and are not the starting values for the European and American charts. NTPK includes the export-oriented productive core including foreign ownership; NEPK is the domestic ownership share thereof.
1. The core in brief
- Growth without a core guarantee (M). The growth in employee labour is concentrated largely in government and healthcare: of the +71,000 FTE in one year, 47,000 FTE were there; the remainder grew by 0.5%. This is a breakdown of employment, not a complete explanation of GDP growth. [1]
Industrial erosion (S). Chemicals, basic industry, steel and automotive suppliers are shrinking simultaneously. With supply-chain factors (automotive 6, chemicals 3, steel 3 to 4), the gross loss in a medium scenario rises to approximately 42,000 FTE and in a severe scenario to approximately 120,000 FTE, plus approximately 17,000 FTE if ASML loses its China revenue.
No margin (M/S). The 2027 deficit is estimated at 2.9% of GDP, with a further 0.1% of GDP (± € 1.3 billion) remaining to the European limit. This already includes € 3.3 billion of additional underspending [21]. On a PBW basis, 2.9% of GDP is approximately 4.6%.
Flight of carriers (M). Capital and entrepreneurship are leaving the EU core for the Gulf, Singapore and Switzerland; the Netherlands responds with an exit tax instead of lower tax pressure [28, 30, 31].
External leverage (M). China systematically, rapidly and selectively imposes export bans and anti-dumping measures, and reverses them as soon as the other side moves [52, 53, 55].
First breaking point (M/S). France is the weakest large country: debt of 115.7% and a deficit of 5.1% of GDP in 2025 [49], a budget that could bring down the government [50], and presidential elections on 18 April and 2 May 2027 [51]. That is the window you identify for the first break.
Tourism (M). A fall of 35% in Mallorca and Barcelona is not reflected in visitor numbers: they are still rising slightly. The break lies in spending: hospitality turnover in Mallorca −12 to −14% in August, cruise passengers −34% and −64% in November and December [62, 63, 65]. That is the early signal of a tourism crisis, not yet the crisis itself.
2. How it happened
2.1 A measurement that conceals the hollowing-out
M. The non-market production of government is largely valued at production costs in monetary terms; for GDP, value added is counted without double-counting purchased intermediate products. The remuneration of government employees amounted to € 103.9 billion in 2025. A higher wage bill can increase nominal value, but does not automatically deliver an equal amount of real GDP growth or additional export income. Taxes and monetary benefits are not production in themselves; imported equipment is likewise not fully domestic value added. The fundamental objection to GDP as the sole economic yardstick is therefore that more measured activity can coincide with lower prosperity, more obligations and a weaker productive earning base. [2, 3, 83, 84]
Exports provide 35.2% of GDP in added value (2023) and 31.4% of employment [4]. The largest part of this is domestic production: Dutch goods 17.2% and services 13.6% of GDP, re-exports 4.3% (2022) [5]. The part in Dutch hands that remains after tax, your NEPK, is approximately 3%. The entire structure rests on this narrow core.
2.2 Energy: the domestic source closed, the grid too expensive
Gas extraction in Groningen has been legally prohibited since 19 April 2024 [6]. The small fields still produced 8.84 billion m³ in 2025 [7]. The price is determined on the European exchange; TTF peaked at € 82.60/MWh on 14 September 2026 [8]. Network charges will rise by approximately 20% in 2027, including for large TenneT customers, and grid investments through 2040 amount to € 235 billion [9]. Industry pays 15% more for electricity than in Belgium, 30% more than in Germany and up to 70% more than in France [10]. Offshore wind lowers the wholesale price, but the costs return through the grid and the return of subsidies.
2.3 Industry: closures with a long chain
| Sector | Measured | Source |
|---|---|---|
| Chemicals | 48,000 direct and 123,000 indirect jobs; the Netherlands accounted for 20% of European factory closures in 2022–2025 | [11] |
| Basic industry | Added value −12% in 2019–2024 | [12] |
| Tata Steel | Approximately 9,000 direct jobs, approximately 30,000 indirect; decision on € 2 billion in support postponed until 1 March 2027 | [13, 14] |
| German automotive industry | −42,300 jobs (−5.8%) through 691,500, lowest since 2005; suppliers −7.6% | [15] |
| German suppliers | 333 insolvency proceedings since the beginning of 2024; employment −13% in 2023–2025 | [16] |
| Wage gap | VW: € 74 per hour in Emden compared with € 12 in Tianjin; factory costs per car € 4,850 compared with € 1,078 | [17] |
| Dutch automotive industry | Approximately 55,000 employees in manufacturing | [18] |
| Industrial unemployment | From almost 14,000 (Dec. 2022) to 20,500 (June 2026); a quarter of employers report insufficient demand | [19] |
S. Calculation with supply-chain factors (scenario, gross FTE, approximately 0.9 FTE per industrial job):
| Item | Direct loss | Factor | Medium (FTE) | Severe (FTE) |
|---|---|---|---|---|
| Automotive suppliers | 7 to 13% of 55,000 | 6 | 21.000 | 39.000 |
| Chemicals | 5 to 10% of 48,000 | 3 | 6.500 | 13.000 |
| Tata Steel | 1,800 to 9,000 | 3 to 4 | 6.000 | 35.000 |
| Dairy and livestock chain | WEcR analysis (8% to 30% contraction) | in analysis | 9.000 | 35.000 |
| Arcadis Netherlands | pro rata up to 3× due to overheads | – | 75 | 250 |
| ASML and suppliers | loss of China revenue, 25,000 employees hired in the Netherlands | 2,8 | – | 17.000 |
| Total | approximately 42,000 | approximately 140,000 |
Gross figures; some find other work while industry still has approximately 30,400 vacancies [19]. In the automotive industry, some double counting is possible because the 55,000 already includes suppliers. The ASML figure uses a number of Dutch employees not verified against the source.
2.4 The budget: no buffer left
The EMU balance is estimated at −2.3% of GDP in 2026, −2.9% in 2027 and −2.5% in 2028 and 2029; GDP 2027 is € 1,278 billion [21]. The Advisory Group on Budgetary Space recommended −2% to keep debt stable [22]. Healthcare grows from € 118 to € 124 billion (2026–2031). Benefit measures and the increase in the excess have been postponed by one to two years [21]. The number of people able to work in healthcare declines by 2040 by one third relative to the number of elderly people [23].
S. At a budgetary effect of € 40,000 to € 50,000 per lost FTE (assumption), the medium scenario costs € 1.7 to 2.1 billion per year and the severe scenario € 4.8 to 6 billion. The deficit then rises to 3.05 to 3.4% of GDP; on an PBW basis, to approximately 5 to 5.5%. Above 3%, the government considers expenditure and revenue measures [21], and healthcare and social security are the largest items.
2.5 Inflation, purchasing power and the spiral
M/S. Inflation was 3.3% in August 2026 [24]; the ECB expects a peak of 3.6% in the fourth quarter [69]. Import tariffs alone produce approximately 1 percentage points as a one-off effect. Supply stoppages (chips, rare earth metals, pharmaceutical raw materials) together with an energy shock could, however, take it into double digits, like the 14.5% of September 2022. If the Strait of Hormuz remains closed, prices could suddenly rise sharply [70].
S. The spiral: tax pressure rises → those who can, leave → production and exports fall → what remains becomes foreign-owned → the burdens of healthcare, state pension, interest and defence rest on a smaller core → tax pressure rises further. Unrest reinforces this through postponed investment and lower consumption; companies are already now mainly making replacement investments [70].
2.6 The departure of capital and carriers
| Destination or measure | Measured | Source |
|---|---|---|
| United Arab Emirates | +9,800 millionaires (estimate 2025), largest inflow | [30] |
| Singapore | More than 2,000 family wealth managers with tax advantages at the end of 2025, compared with approximately 400 in 2020 | [31] |
| European winners | Italy, Switzerland, Greece; losers UK, Germany, France | [29] |
| The Netherlands | Adjusted exit tax since 1 January 2025, aimed at high incomes and wealth | [28] |
| Malta | Effective corporation tax of approximately 5% through a refund; Pillar Two postponed; 15% option (FITWI) since September 2025; golden passports prohibited by the EU Court | [32, 33, 34, 35] |
| Guernsey | 20% flat income-tax rate, 0% standard corporate tax rate, no capital gains, inheritance or VAT levy; outside the UK and EU | [36, 37] |
2.7 China as leverage
| Trigger | Chinese response | Source |
|---|---|---|
| Australia calls for a coronavirus investigation (2020) | Tariffs on barley and wine; lifted after change of government | [57] |
| Lithuania opens Taiwan office (2021) | Trade boycott | [56] |
| EU tariffs on Chinese electric cars (2024) | Anti-dumping measures on cognac, pork and dairy | [55] |
| American tariffs (April 2025) | Export controls on rare earth metals for all countries | [53] |
| The Netherlands takes over Nexperia (2025) | Export ban on Nexperia from China; later exemption | [52] |
M. Full application of Chinese controls on rare earth metals puts $ 6,500 billion of production outside China at risk, according to the IEA [54]. China’s share of ASML’s revenue falls from 33% (2025) to approximately 20% (2026) [58]. China has an EUV prototype under test [60] and a $ 47.5 billion state fund with lithography as its spearhead [61], compared with € 4.7 billion in ASML R&D in 2025 [59].
2.8 Government that fails to act
With an electoral threshold of 0.67% [25], fifteen parties entered the Chamber [26] in 2025. The Jetten cabinet is a minority cabinet with 66 of the 150 seats [27]. Major decisions are being pushed back: Tata Steel to March 2027, nitrogen, grid congestion. Whoever tackles the cause pays the price before the next election; the benefits come afterwards. This means tinkering with the consequences while leaving the foundations untouched.
2.9 My overall judgement of the whole
Europe is largely dismantling its own foundations: by closing its own energy source, burdening the drivers more heavily than the competition, postponing decisions and using a yardstick that conceals the contraction. China, American tariffs and the energy shock accelerate the process, but do not cause it. The outcome is a slow erosion for as long as there is capacity left to exhaust: pension pots, savings, homes and businesses. Slow erosion is more dangerous than a rapid crisis, because each step still seems bearable and nobody intervenes, while what could still have been saved is lost.
2.10 Why a growing GDP can nevertheless conceal a weakening economy
GDP cannot independently demonstrate whether a country's productive earning base, prosperity and economic self-reliance are becoming stronger. GDP measures domestic added value over a period. That is different from the size, quality and resilience of the productive core from which future income must arise. A rising GDP and a weakening NTPK are therefore not necessarily contradictory. [83, 84]
M. Government production counts too, even without being sold at market prices. Non-market production by the government is largely valued in monetary terms through its production costs. More paid-for government services and more domestically produced equipment can therefore increase GDP. GDP does not in itself make clear whether that additional activity expands earning capacity, or is mainly needed to absorb existing damage, threats and disruption. That distinction is essential when assessing productive capacity. [83, 84]
S. Consider a country in which factories are closing while spending on defence, law enforcement and recovery is increasing. The additional domestic production for these tasks counts towards GDP, but does not automatically restore the lost export earnings, suppliers, knowledge and investment capacity. The spending may be necessary and yet coincide with lower discretionary prosperity and a heavier burden on the remaining earning base. A sharp increase in crime is a possible scenario cause here, not a development established in these charts.
The accounting must nevertheless remain sound: a rise in wages or prices is not automatically real volume growth; taxes and cash transfers are not production in themselves; and imported equipment is not fully counted as domestic added value when determining domestic production. The problem is therefore not that every item of government spending is fictitious, but that GDP growth alone does not answer the question of whether the economy is building more sustainable earning capacity and prosperity. [83, 84]
NTPK and NEPK answer a different question. In this article, NTPK is the export-oriented productive core, including the foreign-owned share; NEPK is the domestically owned part of it. The qualitative future chart concerns the expected direction of that core. The historical charts below concern GDP and exports only, and are not presented as NTPK measurements.
2.11 Historical charts: what was measured and how was the index calculated?
M. These two charts describe the past, from 2021 through H1 2026. Each series has its own annual average of 2021 as the starting value 100. An index of 110 therefore means a level 10% above that same base level, not 10% growth in every year and not a comparison of the absolute size of the US and European economies.
The calculation is the same for each series: index in period t = 100 × level in period t ÷ annual average of 2021. For 2021–2025, the average of the four quarterly levels is used; for H1 2026, the average of the first two quarters, without changing the base of 2021. The points are period averages, not end-of-year figures; growth percentages have not been added together. [73–76]
| Series | Source and processing | What the series does not measure |
|---|---|---|
| Real GDP, EU-27 and US | Eurostat quarterly levels in chain-linked volumes, adjusted for season and calendar effects, converted to 2021 = 100. [73, 74] | No separate measurement of NTPK, disposable prosperity or strategic self-reliance. |
| Real exports, US | Exports of goods and services in real volumes, BEA via FRED, converted to the same index base. [75] | No deduction of all foreign inputs and no full adjustment for the productive share and tax burden. |
| Real external exports, EU-27 | Nominal exports outside the EU from the balance of payments, divided by an approximate export price factor from the national accounts. Trade between Member States is not included in the export flow. [73, 76]CP_MEUR ÷ CLV_I20 (namq_10_gdp) | The price factor also includes intra-EU trade and is therefore not an exact price index for extra-EU exports alone; the series is not a NTPK. |
Underlying quarterly data (CSV)
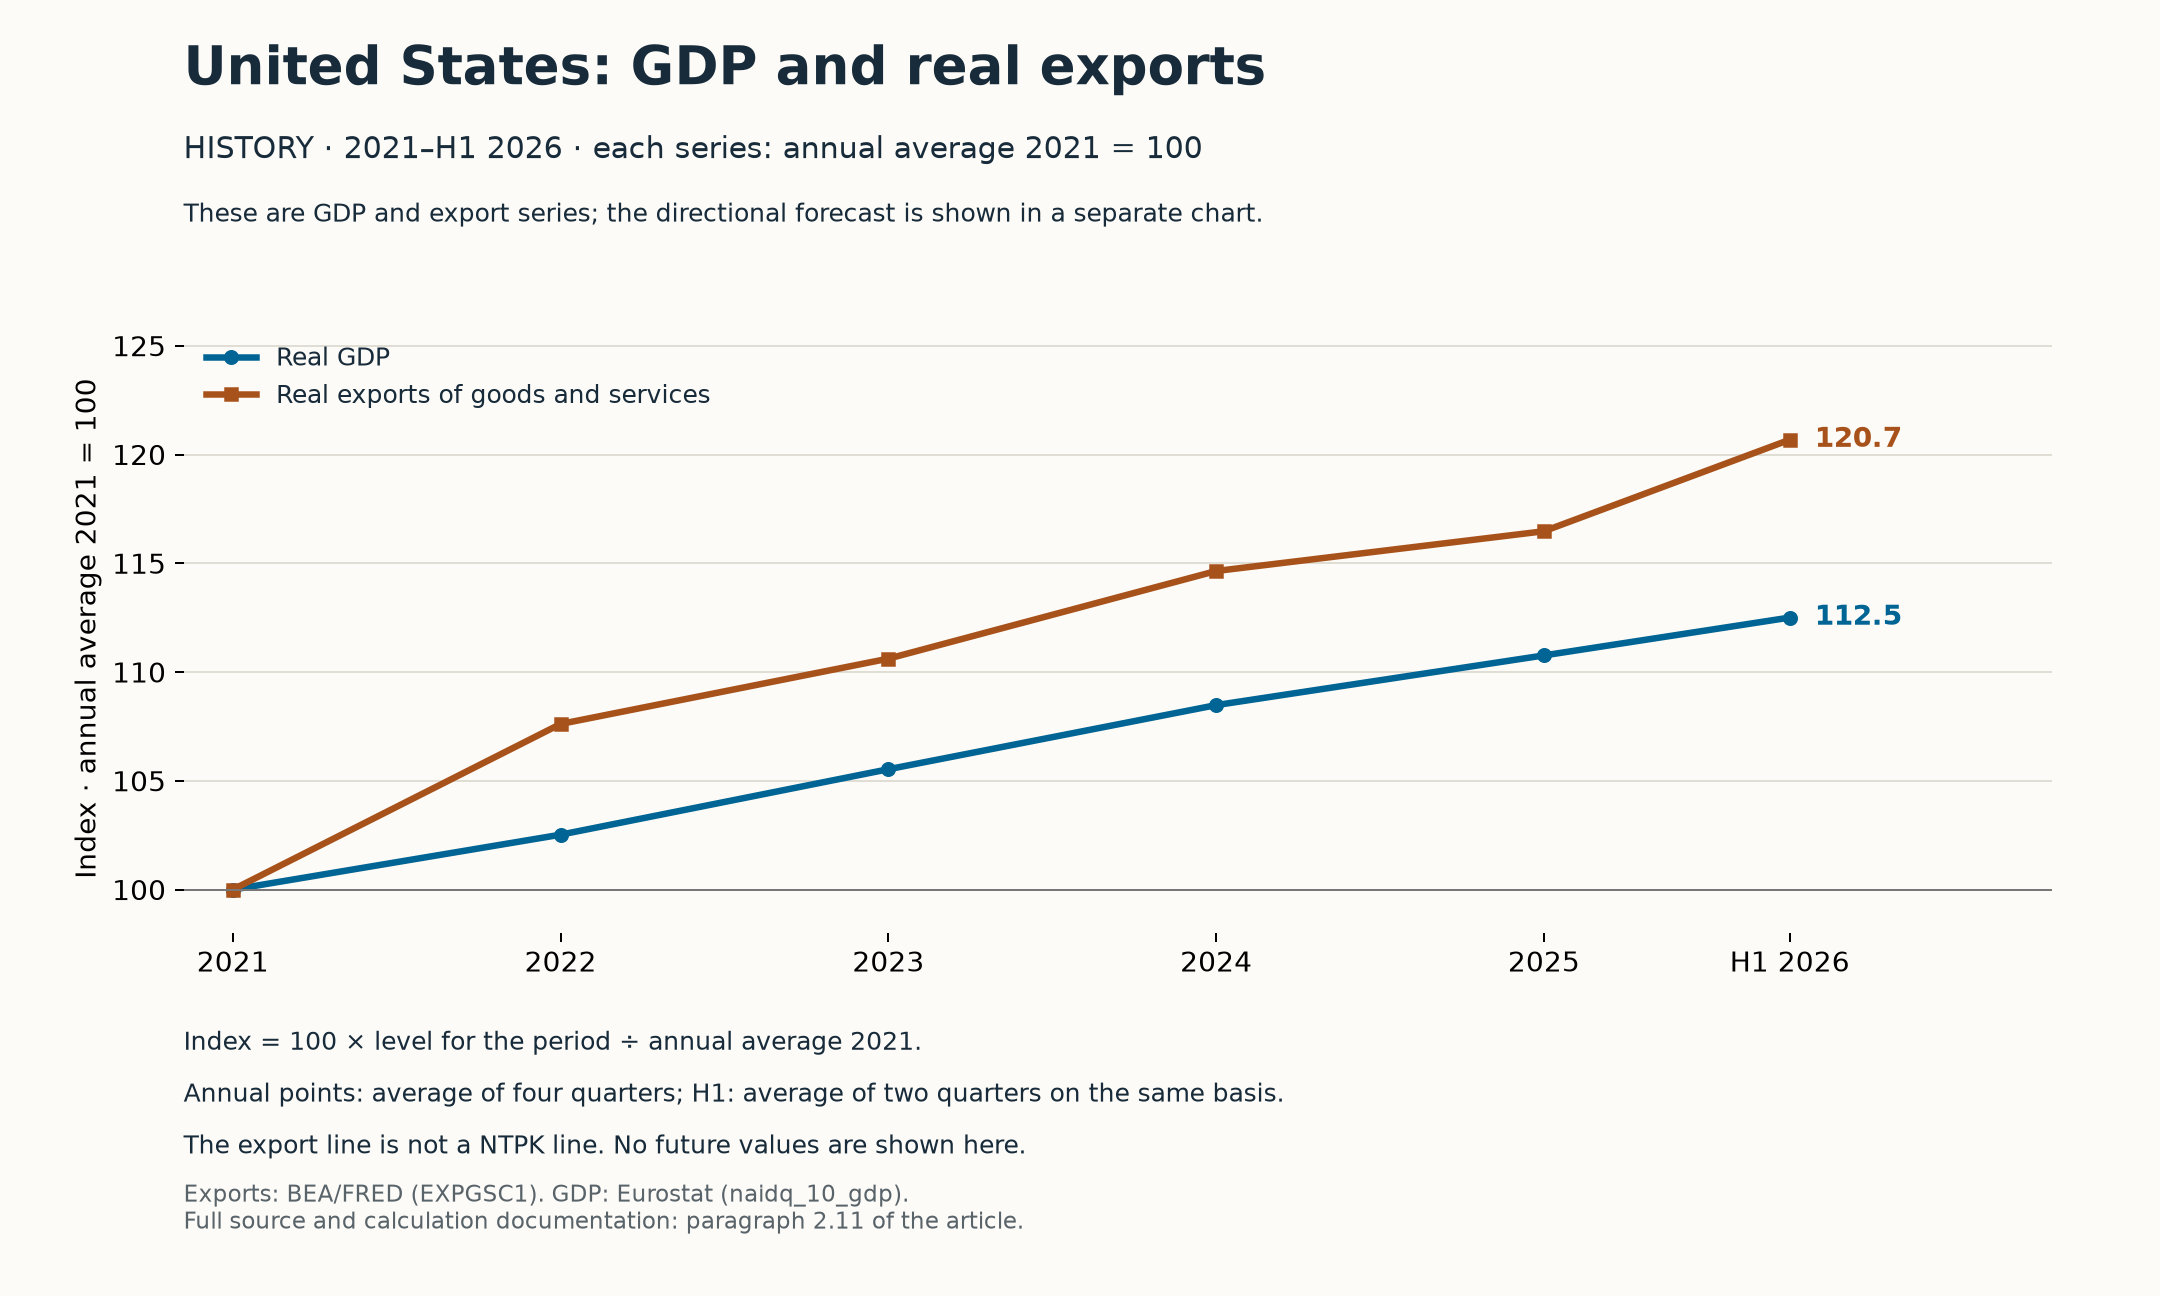
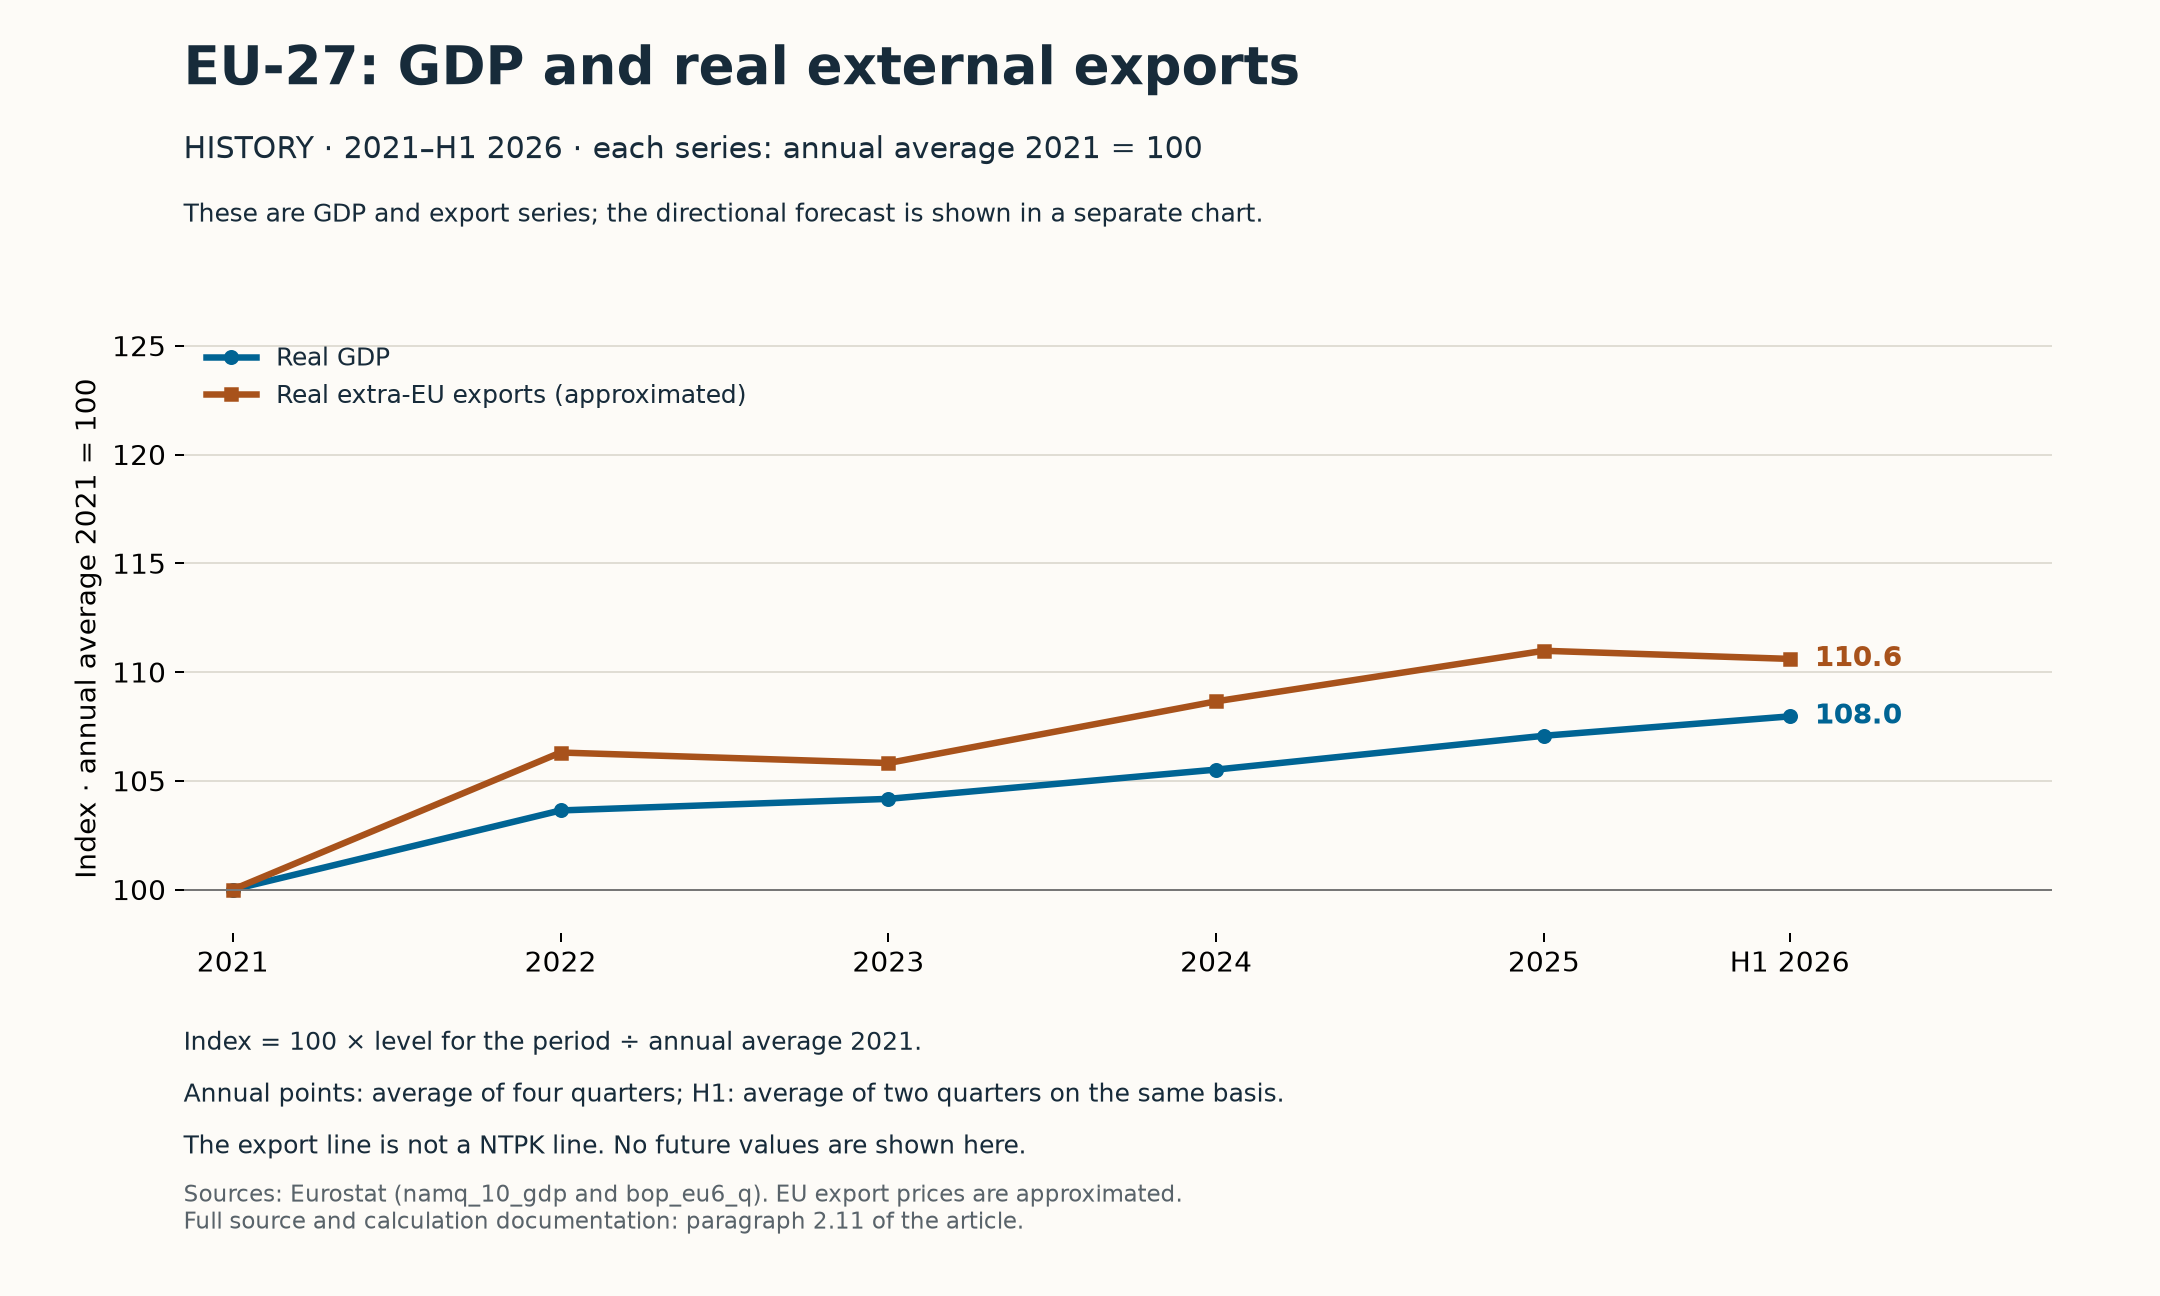
With this method, the GDP indices in H1 2026 stand at 112.5 for the US and 108.0 for the EU-27; the export indices stand at 120.7 and 110.6. The US series have risen more strongly since 2021. The fact that European exports are still above their starting level is not evidence against a later weakening of the productive core: the past level and the direction of the future answer different questions. [73–76]
2.12 What the directional forecast is based on
The future chart is an editorial synthesis of the following signals and mechanisms, not a statistically fitted annual NTPK series. The sources substantiate the risks and the direction chosen; they do not provide the drawn slope, annual index points or width of the grey area. No numerical weights or probabilities have been assigned to these mechanisms.
- Industry, energy and supply chains. The job losses, factory closures, energy costs and supplier problems from paragraphs 2.2 and 2.3 form the factual foundation. The scenario implication is less local production, cash flow and investment capacity, followed by the loss of specialised suppliers and knowledge. The gross FTE scenarios from the tables are not added to the chart again as additional measured job losses. [9–19]
- China: pressure on sales and supply. The Chinese threat of retaliation and existing export controls are reported facts. The scenario is that competition undermines the European earning base, while any European countermeasures could trigger new restrictions on sales or critical inputs. Which additional measures will actually follow is therefore not certain. [80–82]
- Capital, entrepreneurship and government burdens. Paragraphs 2.4–2.6 describe fiscal pressure and the relocation of affluent individuals and economic activities. The scenario implication is that insufficient reinvestment in European production and higher burdens make recovery more difficult. Relocated people, capital, announced investments and actually lost domestic production are not interchangeable amounts. [21, 28–31]
- United States: relatively stronger initial development. The recent GDP and export series show stronger development than those of the EU-27. That supports a relatively more favourable directional expectation here, but does not in itself prove future NTPK growth: trade tensions, disappointing investment returns and financing problems remain downside scenarios. [73–76, 78]
S. The turning point arises where adaptation can no longer happen in time. If an indispensable component runs out before an alternative is usable, production can come to a standstill. If the stoppage lasts longer than financial buffers allow, closures follow in the unfavourable scenario; if suppliers, skilled workers and knowledge then disappear, capacity does not recover automatically when trade picks up again. This chain explains why the European lower end of the scenario zone points further towards weakening.
2.13 Directional forecast 2026–2030: how the lines and the grey area should be read
S. My central directional expectation if current conditions continue is further weakening of the European productive core, against a relatively stronger, flat-to-rising trajectory in the United States. This is a conditional judgement about the direction of NTPK, not a prediction that European GDP will fall every year or that every US sector will grow.
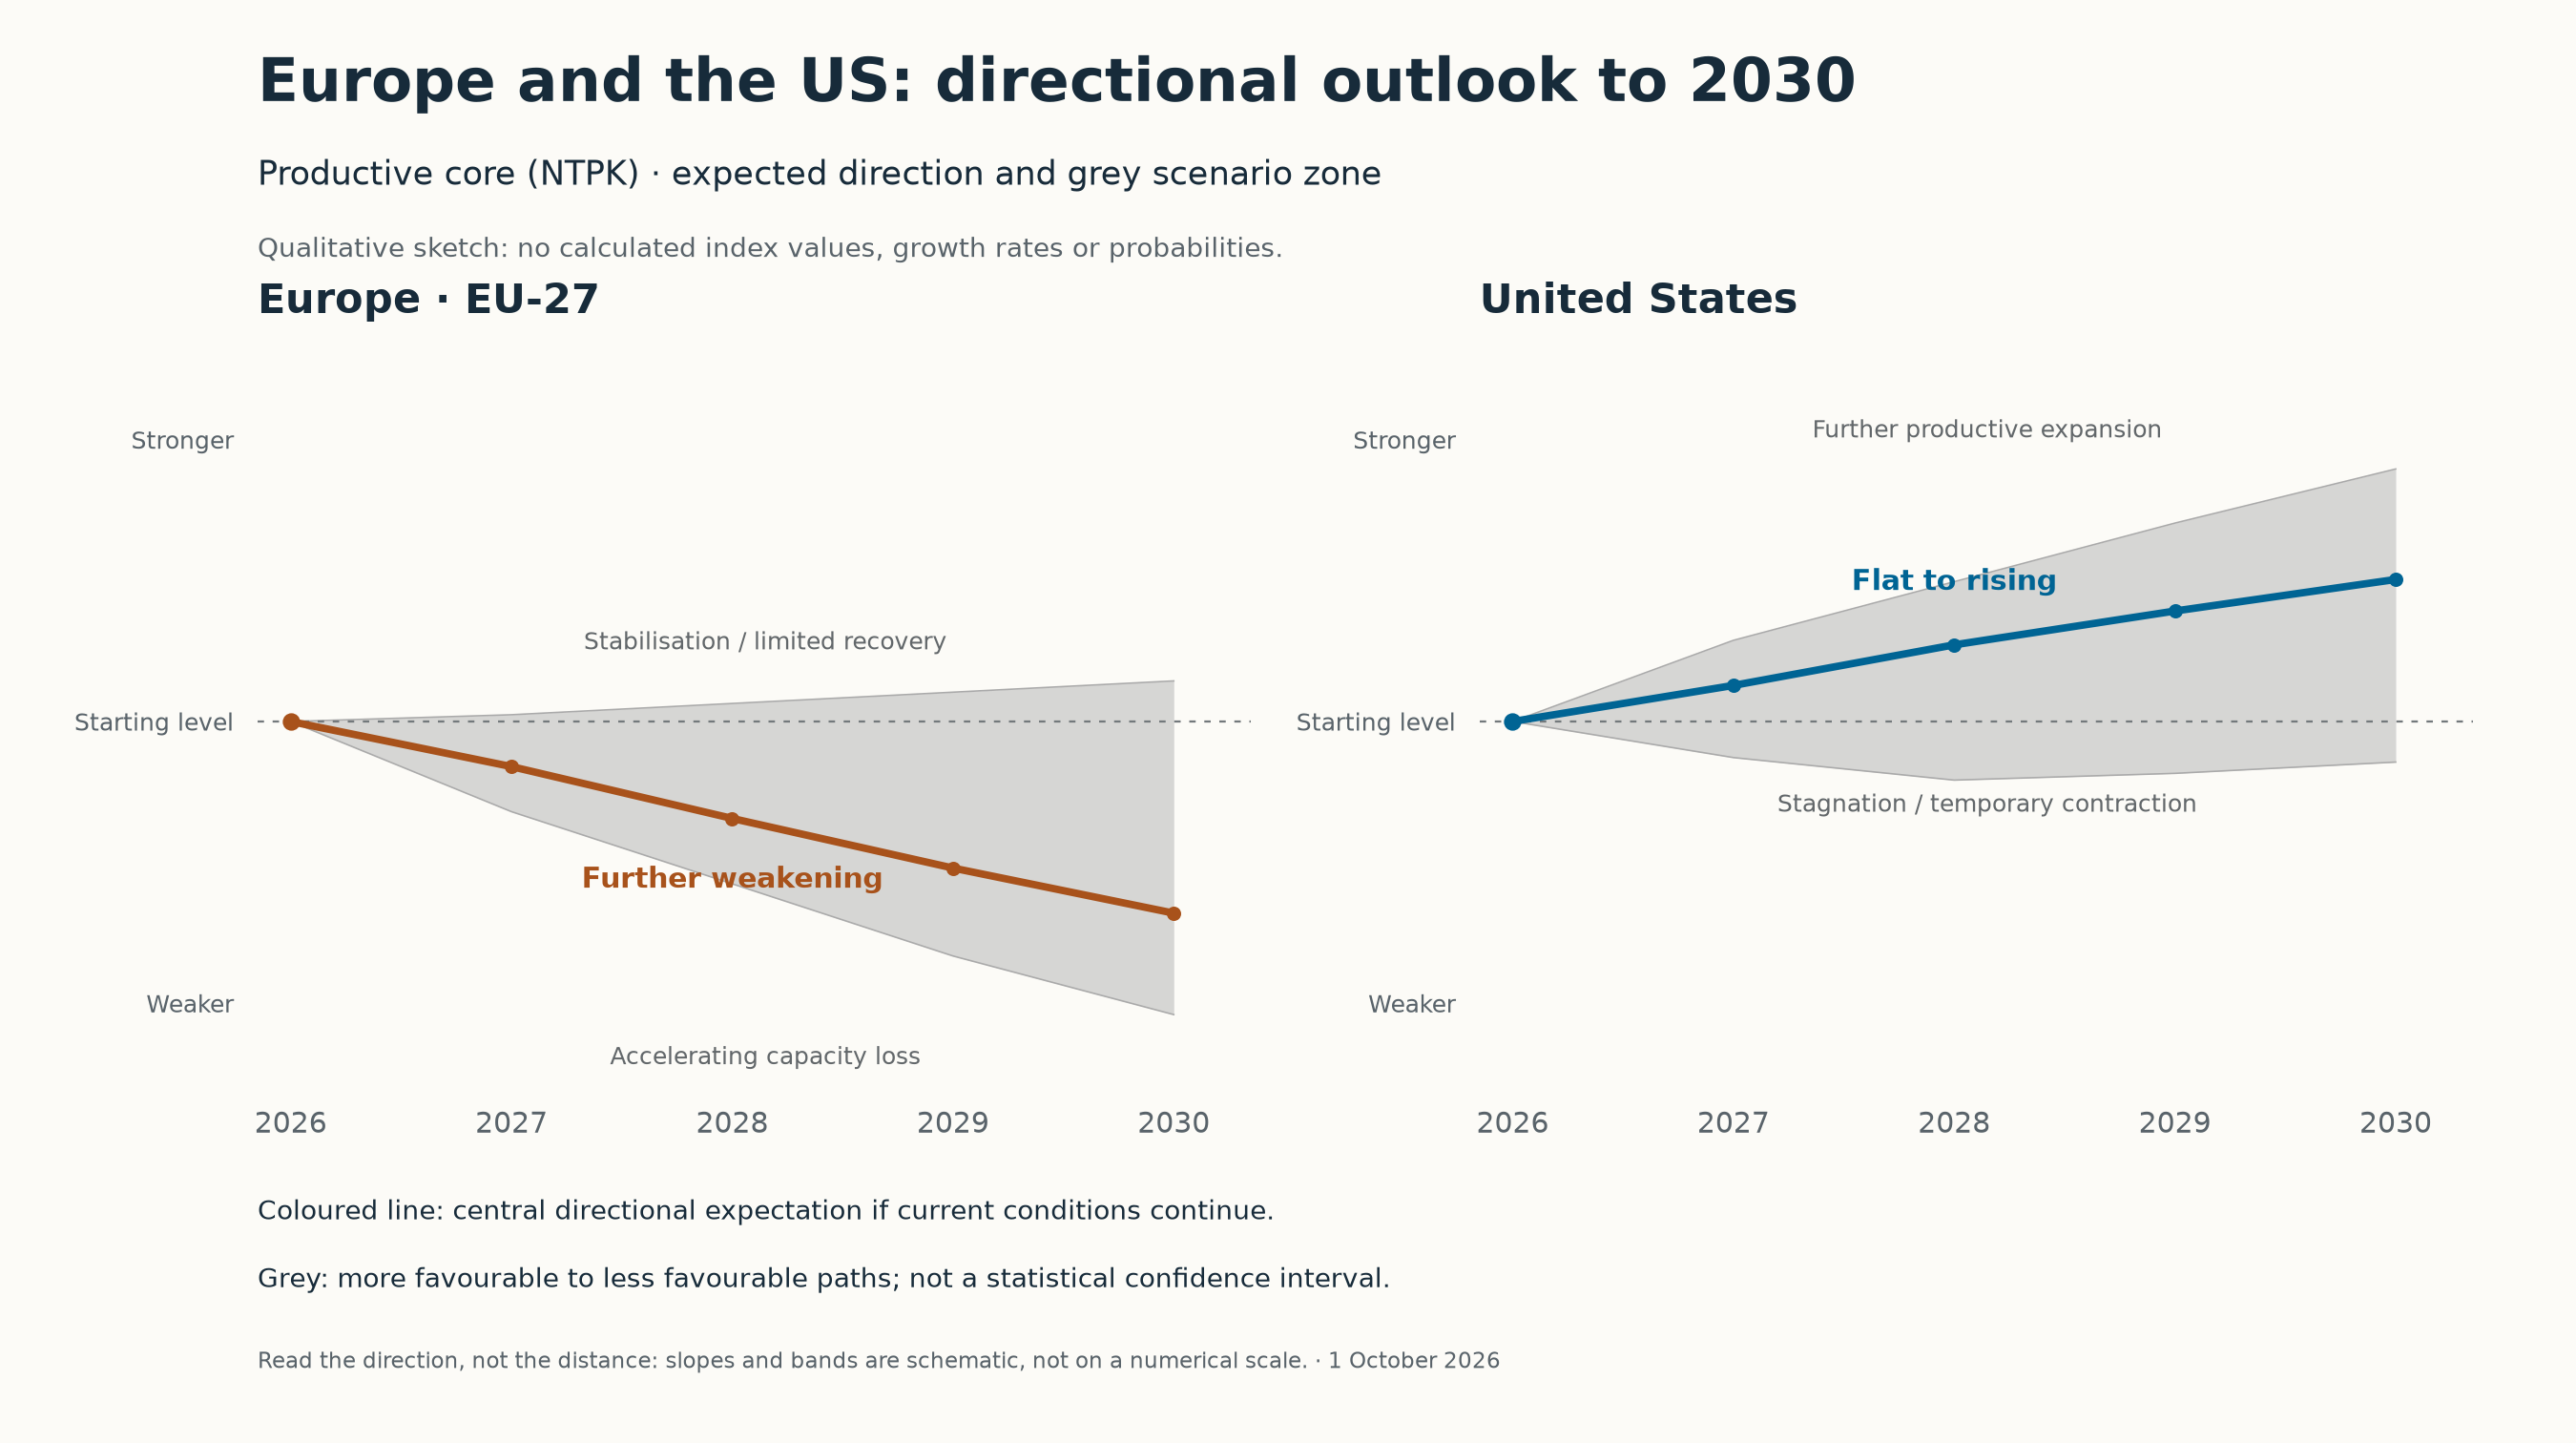
- The horizontal axis is time. The period runs from 2026 to 2030. The individual annual points are not the results of an annual NTPK calculation.
- The vertical axis is qualitative. “Starting level” refers to the individual starting situation of each region in 2026, not to a measured common index or equal absolute size. The distance between points represents neither a percentage nor a monetary amount; this axis must not be linked to the historical index 2021 = 100.
- The coloured line is the central directional expectation. It shows the described trajectory if current conditions continue, not a statistically established expected value.
- The grey area is a scenario zone. For Europe, the favourable side involves stabilisation or limited recovery through better production and investment conditions; on the unfavourable side, closures, supply-chain disruption and loss of investment capacity accelerate. For the US, the zone runs from stagnation or temporary contraction to further productive expansion. Its width is schematic and does not express a calculated spread, margin of error or probability of 80% or 95%.
The connection is therefore clear: the historical charts show what GDP and exports have done; the directional forecast describes what may happen to the productive core according to the mechanisms identified. Rising GDP need not strengthen that core. The warning of this article is precisely that organising, securing and financing a society may require ever more activity while its independent earning base weakens.
3. France as the first breaking point and the sequence thereafter
The scenario is that a rupture between rich and poor first becomes visible in France around April and May 2027, and then in other countries. In the forecasting work, revolution primarily means a phase-3 decline in prosperity, resilience and institutional legitimacy, not primarily a street scene. This chapter tests the timing against what is established.
| Timing | What is established | What the scenario shifts | Source |
|---|---|---|---|
| October 2026 | French budget must be finalised by early October; previous negotiations brought down governments | Fall of the government, interest-rate premium, rating downgrade | [50] |
| 2025–2026 | French debt 115.7% and deficit 5.1% of GDP (2025) | Interest payments displace social spending | [49] |
| 7 February 2027 | Deadline for calling voters; start collecting 500 signatures | Polarisation in the campaign | [51] |
| 1 March 2027 | End of Tata Steel letter of intent | Signal for the Dutch basic industry | [14] |
| 18 April and 2 May 2027 | First and second rounds of the French presidential election | Your rupture window: an outcome that markets or the street will not accept | [51] |
| 2027–2028 | Dutch deficit 2.9% of GDP in 2027 with a 0.1% margin | Exceeding 3% in industrial job losses | [21] |
The calendar indeed makes April–May 2027 the most vulnerable moment in Europe, because an election coincides with a debt position without a buffer. Whether it becomes a revolution or a prolonged political and financial crisis, I cannot determine. For an individual structuring plan, that makes little difference: in either case, it is necessary for capital to be structured outside the reach of an acute crisis before that date and for a plan to be in place to deploy it productively afterwards. The order of other countries depends on the same three factors: debt without productive backing, industry’s energy costs and governability.
4. An own bank and an own Marshall Plan
4.1 What the Marshall Plan really was
Between 1948 and 1951, the US sent approximately 1% of its GDP annually to Europe, approximately $ 13 billion in total; that was less than 2.5% of the recipients’ combined income [46]. More than 90% was in grants [47]. In Germany, KfW was established in 1948 to pass on the Marshall funds; the ERP assets still operate as a revolving fund [48].
The lesson is that it was not the size that was decisive, but the link between money and the recovery of production. The money was lent to companies that produced, repaid and lent out again. An own Marshall Plan must therefore not be a savings pot, but a revolving productive fund with a bank or credit institution as its operator.
4.2 The legal routes side by side
| Route | What is permitted | Capital and requirements | Processing time | Source |
|---|---|---|---|---|
| Guernsey Private Investment Fund (PIF) | Pooling capital from a limited circle of qualified investors; not from the public | Designated administrator required; no auditor required | 1 working day after a complete application (fast track) | [42, 41] |
| Guernsey banking licence | Accepting deposits and granting credit | Capital ratio at least 11%, in practice 12 to 16%; application fee £ 50,925 (2026) | No fixed timeframe; early consultation with the GFSC required | [39, 40] |
| EU bank (ECB licence) | Full bank with European passporting rights | Statutory € 5 million, realistically € 20 to 100 million CET1 | Decision within 12 months of application; 2 to 5 years in total | [43, 44] |
| Swiss FinTech licence | Up to CHF 100 million in deposits, no investing and no interest | Registered office and activity in Switzerland; no deposit guarantee | Depending on the application | [45] |
| EU electronic money institution | Payments and electronic money, no lending | € 350.000 | Months | [44] |
Guernsey as the governance and capital base, because it is outside the EU, fiscally neutral and has rapid fund structures, appears to be the best solution. A full banking licence only makes sense once there is a counter of several hundred million. For deployment in the EU after the crisis, an EU-licensed partner or subsidiary will ultimately also be needed. The Swiss FinTech licence is unsuitable as a reconstruction bank, because deposits may not be lent out.
4.3 The build-up in four layers
1. Layer 1 – Capital pool (now until mid-2027). An own PIF or Family PIF in Guernsey pools the capital of participants who are leaving or wish to protect their assets. Objective: legal certainty and no commingling with an acute crisis. Hard condition: full identification of participants and the origin of funds.
2. Layer 2 – Investment company (2027–2028). A holding company in Guernsey takes stakes in productive companies with proprietary ownership: energy, raw materials, biobased materials, engineering. The measure is not short-term return, but whether the investment increases the productive core (NTPK) and remains in own hands (φ).
3. Layer 3 – Own bank (2028–2031). Once the pool is large enough, a banking licence in Guernsey, followed by an EU partner bank or subsidiary for operations on the mainland. Allow 2 to 5 years and initial capital of tens of millions.
4. Layer 4 – Revolving reconstruction fund (from the recovery onwards). After the crisis, the bank lends to reconstruction projects, receives repayment and lends out again, as KfW does with the ERP assets. Priority for projects that restore energy, basic industry and exports.
4.4 Timeline and time factors
| Period | Step | Dependency | Risk if too late |
|---|---|---|---|
| Q4 2026 | Choice of structure, legal and tax assessment of departure and claims | Your exit tax travels with you | New tax rules before departure |
| Q1 2027 | PIF and holding company established; first participants | Administrator, bank for custody | Capital locked up in EU crisis |
| Before April 2027 | Capital structured outside the reach of an acute crisis | French elections 18 April and 2 May | Market panic, capital controls, interest-rate shock |
| 2027–2028 | First productive investments | Energy and permits by country | Assets bought up cheaply by third parties |
| 2028–2031 | Banking licence and EU partner | Capital and governance with a track record | No implementation channel for recovery |
| After the crisis | Revolving reconstruction loans | Stable rule of law in the target country | Too late for the cheap construction phase |
The most important time factor is that trust, permits and track record cannot be bought at the moment the crisis breaks out. Anyone who only seeks these afterwards is too late. The second factor is the Dutch claim: according to your dossier, it does not become time-barred and goes with it to Guernsey. A claim, however, is worth no more than what can ultimately be collected; if the system erodes the underlying value, it erodes its own claim.
4.5 Conditions and pitfalls
Money-laundering rules and reputation. A fund or bank that is seen as a refuge receives stringent scrutiny of the origin of funds. Full transparency is the only way to be allowed to operate in the EU later.
Dependence on payment systems. A bank in Guernsey is also dependent on correspondent banks and payment systems. Without those channels, the money cannot reach the projects after the crisis. The most important payment system will be the Dollar, as Europe will slide and the European currency with it.
Minimum tax. The European minimum tax of 15% applies to groups with at least € 750 million in turnover; below that it does not apply, above it does.
Governance. The fund must be governed by people with banking and industrial experience, and must not depend on a single person. That is also a requirement of every regulator.
Scale. Guernsey has approximately 64,500 inhabitants and only 1,607 Open Market homes, 5.8% of the stock [38]. It is a base for administration and capital, not a production location.
5. Tourism: from spending shock to possible disaster
5.1 What is currently measured
| Indicator | Measured | Source |
|---|---|---|
| Balearic Islands, visitors May–July 2026 | 8.2 million, +2.1%; Mallorca 5.5 million, +2.5%; July +0.2% | [62] |
| German visitors to the Balearic Islands | July −4.1%; April −13.7% | [66, 62] |
| Mallorca hospitality turnover | August −12 to −14%, whole year −6 to −8% (CAEB forecast); worst start to September that anyone can remember | [63, 64] |
| Cruise passengers in Palma | November −34%, December up to −64% | [65] |
| Barcelona, regulated accommodation up to July | 8.1 million tourists, +3.6%; overnight stays +2.2% | [67] |
| World, first half of 2026 | +0.4%; second quarter −1%; Middle East −22%; annual forecast reduced from 3–4% to 1–2% | [68] |
I cannot find a decline in visitors to Mallorca or Barcelona in the official figures. What is around that magnitude is the fall in cruise passengers in Palma in winter. The real signal is that as many or more tourists are coming, who spend less per person because flights and accommodation have become more expensive [63]. A tourism crisis begins on the spending side before it becomes visible in visitor numbers.
5.2 How a collapse would unfold
Mechanism in four steps:
1. Higher kerosene and energy prices make flights and hotels more expensive; this is already visible in global growth of 0.4% and the decline of 22% in the Middle East [68].
2. Falling real incomes in north-western Europe, the source of most southern European tourists, first reduce spending per person and then the number of trips. German visitors are already showing that second step.
3. In a French or broader European crisis, or a war, part of demand disappears in a single season. Tourist regions with high fixed costs (hotels, airports, hospitality staff) cannot then shrink quickly.
4. Because flight routes, cruises and hotel chains are globally connected, a European downturn spreads to destinations that depend on European travellers, such as North Africa, the Caribbean and South-east Asia.
My judgement: a tourism disaster is realistic if the energy scenario deteriorates and European incomes fall, and would then first affect Mallorca, the Canary Islands, the Greek islands and Barcelona. At present the sector is in the first phase: stable numbers, falling spending. The tipping point becomes visible when visitor numbers also fall for two seasons in a row.
6. Final judgement
Europe is losing its former position through its own choices: excessively expensive energy, excessive burdens on a narrow productive core, postponed decisions and a yardstick that conceals the contraction. The Dutch productive core in domestic hands is approximately 3% of GDP; upon that rests the edifice of healthcare, education, benefits, interest and defence. As long as there is wealth to draw down, the decline proceeds slowly, and that makes it dangerous. France in April and May 2027 is the most likely first breaking point. Anyone wishing to deploy capital for a reconstruction must structure it before that time, outside the reach of an acute crisis, and link it to production, as the Marshall Plan did through KfW. Europe's recovery to its former position is a matter of generations, not years.
Sources
[1] CBS StatLine 85917NED – Labour accounts, jobs and labour years. https://opendata.cbs.nl/statline/CBS/nl/dataset/85917NED
[2] CBS StatLine 84576NED – Government production at cost. https://opendata.cbs.nl/statline/CBS/nl/dataset/84576NED
[3] CBS – Government deficit and debt increased in 2025, government expenditure. https://www.cbs.nl/nl-nl/longread/diversen/2026/overheidstekort-en-schuld-toegenomen-in-2025/3-uitgaven-overheid-6-procent-hoger
[4] CBS StatLine 86068NED – Value added and employment through exports. https://www.cbs.nl/nl-nl/cijfers/detail/86068NED
[5] CBS – The Netherlands as a trading nation 2024. https://download.cbs.nl/maatwerk/Nederland-Handelsland-2024.pdf
[6] Parliamentary document 33529-1238 – Act banning gas extraction in Groningen. https://zoek.officielebekendmakingen.nl/kst-33529-1238.html
[7] Parliamentary letter on gas extraction in small fields 2025. https://zoek.officielebekendmakingen.nl/kst-1252486.pdf
[8] Energievergelijk – Gas price on the exchange, 22 September 2026. https://www.energievergelijk.nl/nieuws/gasprijs-op-de-beurs-16-omlaag-deze-leveranciers-verlaagden-hun-tarieven-al
[9] Netbeheer Nederland – Network tariffs 2027 rise. https://www.netbeheernederland.nl/artikelen/nieuws/nettarieven-2027-stijgen-maar-slimme-keuzes-kunnen-stijging-remmen
[10] VEMW – High electricity costs for industry, 27 January 2026. https://www.vemw.nl/nieuwsbericht/2026/01/27/vemw-roept-tweede-kamer-op-benut-europese-ruimte-om-hoge-elektriciteitskosten-industrie-te-verlagen
[11] VNCI – Position paper for the First Chamber, 4 February 2026. https://www.eerstekamer.nl/bijlage/20260206/position_paper_manon_bloemer_vnci/document3/f=/vmutqwx34ryu.pdf
[12] EW – Large companies on the verge of collapse: who will save Dutch industry?. https://www.stimulus.nl/just-transition-fund/wp-content/uploads/sites/13/2025/08/Grote-bedrijven-op-instorten_-wie-redt-de-Nederlandse-industrie_-EW.pdf
[13] Territorial Just Transition Plan IJmond. https://www.zuid-holland.nl/publish/besluitenattachments/indiening-nederlands-territorial-just-transition-plan-voor-het-just-transition-f/bijlage-1d-tjtp-nederland-h2-ijmond-pdf.pdf
[14] NU.nl – Agreements on billions in support for Tata Steel are delayed again. https://www.nu.nl/klimaat/6410718/afspraken-over-miljardensteun-tata-steel-lopen-opnieuw-vertraging-op.html
[15] Business AM – German car industry loses 42,300 jobs (Destatis). https://businessam.be/duitse-auto-industrie-verliest-42-300-banen-en-zakt-naar-laagste-niveau-sinds-2005/
[16] Ebner Stolz – Study on the structural crisis among automotive suppliers 2026. https://www.ebnerstolz.de/de/unser-angebot/branchen/automotive/studie-automobilzulieferer-strukturkrise-2026-handlungsfelder-mittelstand-111590.html
[17] tz.de – 74 euros versus 12 euros hourly wage: VW makes the China comparison. https://www.tz.de/wirtschaft/zur-krisenformel-74-euro-gegen-12-euro-stundenlohn-vw-macht-den-china-vergleich-zr-94473134.html
[18] RAI Association – Automotive acceleration agenda 2025. https://www.raivereniging.nl/file/upload/doc/versnellingsagenda-2025-2.pdf
[19] UWV – Labour market information: industry. https://www.uwv.nl/nl/arbeidsmarktinformatie/sector/industrie
[20] UWV – Labour market forecast 2026–2028. https://www.uwv.nl/assets-kai/files/98e81276-a408-4cb2-b3c7-d793f988d5b1/uwv-arbeidsmarktprognose-2026-2028.pdf
[21] Budget Memorandum 2027. https://www.rijksoverheid.nl/site/binaries/site-content/collections/documents/2026/09/15/miljoenennota-2027/00-miljoenennota-pdf.pdf
[22] Study Group on Budgetary Space – press release 11 July 2025. https://www.rijksoverheid.nl/actueel/nieuws/2025/07/11/persbericht-studiegroep-begrotingsruimte
[23] PBL – Shortage of carers for older people. https://www.pbl.nl/publicaties/tekort-aan-verzorgers-voor-ouderen
[24] CBS – Inflation rises to 3.3 per cent in August 2026. https://www.cbs.nl/nl-nl/nieuws/2026/37/inflatie-stijgt-naar-3-3-procent-in-augustus
[25] Parlement.com – Electoral threshold. https://www.parlement.com/kiesdrempel
[26] Electoral Council – Result of the 2025 general election. https://www.kiesraad.nl/actueel/nieuws/2025/11/7/kiesraad-uitslag-tweede-kamerverkiezing-vertrouwbaar-en-betrouwbaar
[27] Parlement.com – Jetten cabinet. https://www.parlement.com/kabinet-jetten-2026-heden
[28] Grenzenloos – Emigration tax comes into force. https://grenzenloos.nl/emigratiebelasting-van-kracht-maar-voor-wie-precies/
[29] Henley & Partners – Private Wealth Migration Report 2026. https://www.henleyglobal.com/newsroom/press-releases/henley-private-wealth-migration-report-2026
[30] Patrician – Where are millionaires moving (Henley estimates 2025). https://patrician.ch/answers/where-are-millionaires-moving/
[31] MAS – Written reply on Single Family Offices, 5 August 2026. https://www.mas.gov.sg/news/parliamentary-replies/2026/written-reply-on-sfos
[32] Malta Expat – Corporate tax. https://maltaexpat.com/business/corporate-tax/
[33] EY Malta – Direct tax newsletter March 2026 (Pillar Two). https://www.ey.com/en_mt/newsroom/ey-newsletters/tax/malta-direct-tax-newsletter-march-2026
[34] Trustmoore – Malta FITWI regime 15%. https://www.trustmoore.com/private-clients-archive/maltas-fitwi-regime/
[35] Reuters – EU top court rules against Malta golden passport scheme. https://www.reuters.com/world/europe/eu-top-court-rules-against-maltas-golden-passport-scheme-2025-04-29/
[36] KPMG – Tax in Guernsey. https://kpmg.com/dp/en/services/tax/family-office-private-client/tax-in-guernsey.html
[37] House of Commons Library – How autonomous are the Crown Dependencies?. https://commonslibrary.parliament.uk/how-autonomous-are-the-crown-dependencies/
[38] Bailiwick Express – Residential property stock 2025. https://www.bailiwickexpress.com/news-ge/guernsey-continues-to-see-steady-growth-in-residential-housing-stock/
[39] GFSC – Banking FAQs (capital requirements). https://www.gfsc.gg/industry-sectors/banking/faqs
[40] GFSC – Banking fees 2026. https://www.gfsc.gg/industry-sectors/banking/fees
[41] GFSC – Application timeframes. https://www.gfsc.gg/commission/complaints-standards/application-timeframes
[42] GFSC – Private Investment Fund Rules and Guidance 2025. https://www.gfsc.gg/sites/default/files/media/helix-file/Private%20Investment%20Fund%20Rules%20and%20Guidance%202025.pdf
[43] ECB Banking Supervision – Supervisory guides (licensing period art. 15 CRD). https://www.bankingsupervision.europa.eu/ecb/pub/pdf/ssm.supervisory_guides_202609.en.pdf
[44] Crassula – EU bank licence guide 2026. https://crassula.io/guides/licenses/eu-bank/
[45] FINMA – FinTech licence. https://www.finma.ch/en/authorisation/fintech/fintech-bewilligung/
[46] BIS – Review: The Marshall Plan. https://www.bis.org/review/r970602c.pdf
[47] Boston University GDP Center – The Marshall Plan. https://www.bu.edu/gdp/2025/12/17/international-investment-pushes-past-and-present-part-1-the-marshall-plan/
[48] KfW – 70 years of the Marshall Plan, start-up capital for KfW. https://www.kfw.de/%C3%9Cber-die-KfW/Newsroom/Aktuelles/Pressemitteilungen-Details_421824.html
[49] Direction générale du Trésor – Public finances, 21 September 2026. https://www.tresor.economie.gouv.fr/Articles/2026/09/21/finances-publiques-une-situation-degradee-un-redressement-necessaire
[50] CNBC – France budget, debt and deficit, 24 September 2026. https://www.cnbc.com/2026/09/24/france-budget-debt-deficit-government.html
[51] Service-Public.fr – Presidential election 2027: 18 April and 2 May. https://www.service-public.gouv.fr/particuliers/actualites/A15053
[52] France 24 – Nexperia banned from exporting from China. https://www.france24.com/en/live-news/20251014-chipmaker-nexperia-says-banned-from-exporting-from-china
[53] Reuters – China hits back at US tariffs with rare earth export controls. https://www.reuters.com/world/china-hits-back-us-tariffs-with-rare-earth-export-controls-2025-04-04/
[54] Reuters – China rare earth curbs endanger $6.5 trillion Western industry (IEA). https://www.reuters.com/business/autos-transportation/chinas-rare-earth-curbs-endanger-65-trillion-western-industry-iea-says-2026-07-16/
[55] Reuters – China probes EU products following EV tariffs. https://www.reuters.com/business/chinas-probes-eu-products-following-ev-tariffs-2026-02-11/
[56] CSIS – China’s economic coercion: lessons from Lithuania. https://www.csis.org/analysis/chinas-economic-coercion-lessons-lithuania
[57] USSC – China’s trade restrictions on Australian exports. https://www.ussc.edu.au/chinas-trade-restrictions-on-australian-exports
[58] Quantumrun – ASML statistics (China share of revenue). https://www.quantumrun.com/consulting/asml-statistics/
[59] ASML – Annual Report 2025, financials. https://www.asml.com/en/investors/annual-report/2025/financials
[60] Reuters – How China built its Manhattan Project to rival the West in AI chips. https://www.reuters.com/world/china/how-china-built-its-manhattan-project-rival-west-ai-chips-2025-12-17/
[61] EE Times – China invests billions to close critical chokepoints. https://www.eetimes.com/china-invests-billions-to-close-critical-chokepoints/
[62] Diario de Mallorca – Llegada de turistas a Baleares sigue al alza, 28 September 2026. https://www.diariodemallorca.es/mallorca/2026/09/28/llegada-turistas-baleares-sigue-alza-134736539.html
[63] Mallorca Magazin – Restaurant-Präsident verzweifelt an der neuen Sparsamkeit, 24 August 2026. https://www.mallorcamagazin.com/nachrichten/tourismus/2026/08/24/156469/mallorcas-restaurant-prasident-verzweifelt-der-neuen-sparsamkeit-der-touristen.html
[64] El Debate – Alarmas en los restaurantes de Mallorca, 10 September 2026. https://www.eldebate.com/espana/baleares/20260910/alarmas-saltan-restaurantes-mallorca-peor-arranque-septiembre-recuerda_457537.html
[65] Crónica Balear – Pérdida de cruceros en invierno, 10 February 2026. https://www.cronicabalear.es/mallorca/2026-02-10/el-comercio-de-palma-preocupado-por-la-perdida-de-cruceros-en-invierno/
[66] Mallorca Magazin – Deutsche Urlauber kehren Mallorca zunehmend den Rücken. https://www.mallorcamagazin.com/nachrichten/lokales/2026/09/02/156849/sowas-deutsche-urlauber-kehren-mallorca-zunehmend-den-rucken.html
[67] Ajuntament de Barcelona – Tourism impact up to July 2026. https://ajuntament.barcelona.cat/turisme/en/latest-news/news/tourism-generates-an-impact-of-67817-million-euros-in-the-period-up-to-july-40908
[68] Hospitality Net – UN Tourism: 0.4% growth in the first half 2026. https://www.hospitalitynet.org/news/4134434/international-tourism-holds-steady-with-04-growth-in-first-half-of-2026-as-middle-east-conflict-and-rising-costs-weigh-on-momentum
[69] ECB – Staff macroeconomic projections September 2026. https://www.ecb.europa.eu/press/projections/html/ecb.projections202609_ecbstaff~8e340fc69d.en.html
[70] ABN AMRO – Implications of the conflict in Iran are becoming apparent. https://www.abnamro.com/research/nl/onze-research/gevolgen-van-het-conflict-in-iran-tekenen-zich-af
[71] Eurostat — annual real GDP, European Union (EU-27), nama_10_gdp. https://ec.europa.eu/eurostat/databrowser/view/nama_10_gdp/default/table
[72] Eurostat — annual real GDP, United States, naida_10_gdp. https://ec.europa.eu/eurostat/databrowser/view/naida_10_gdp/default/table
[73] Eurostat — quarterly GDP and export price approach EU-27, namq_10_gdp. https://ec.europa.eu/eurostat/databrowser/product/view/namq_10_gdp
[74] Eurostat — quarterly GDP United States, naidq_10_gdp. https://ec.europa.eu/eurostat/databrowser/view/naidq_10_gdp/default/table
[75] BEA/FRED — Real Exports of Goods and Services, EXPGSC1, quarterly levels, chained dollars 2017. https://fred.stlouisfed.org/data/EXPGSC1
[76] Eurostat — consolidated extra-EU exports of goods and services, bop_eu6_q, credit, SCA, EU27_2020/EXT_EU27_2020. https://ec.europa.eu/eurostat/databrowser/view/bop_eu6_q/default/table
[77] European Commission — European Economic Forecast, Spring 2026, Institutional Paper 341, May 2026, information cut-off 4 May 2026; GDP baseline forecasts for the US/EU and adverse energy scenario. https://economy-finance.ec.europa.eu/document/download/3360898c-cd40-46c0-b170-7adfcb993add_en?filename=ip341_en.pdf
[78] Reuters — OECD expects AI boom to help offset Middle East energy shock for now, 23 September 2026. https://www.reuters.com/world/china/oecd-expects-ai-boom-help-offset-middle-east-energy-shock-now-2026-09-23/
[79] OECD — Good Jobs for All in a Changing World of Work, 2018; redundancy costs, labour mobility, productivity and firm-specific knowledge. https://www.oecd.org/content/dam/oecd/en/publications/reports/2018/12/good-jobs-for-all-in-a-changing-world-of-work_g1g995e1/9789264308817-en.pdf
[80] Reuters — China vows response if EU introduces moves targeting Chinese trade, report dated 30 September 2026, published 29 September at 23:32 UTC; official Chinese warning and distinction from the options mentioned by Global Times. https://www.reuters.com/world/asia-pacific/china-vows-response-if-eu-introduces-moves-targeting-chinese-trade-2026-09-29/
[81] European Commission — EU trade relations with China, accessed 30 September 2026; existing export controls, disruption of European supply chains, unequal market access and import substitution. https://policy.trade.ec.europa.eu/eu-trade-relationships-country-and-region/countries-and-regions/china_en
[82] CSIS — EU-China Relations Face an Existential Test, but Escalation Is Not Inevitable, 29 September 2026; analysis of export licences, countermeasures and diverging European interests. https://www.csis.org/analysis/eu-china-relations-face-existential-test-escalation-not-inevitable
[83] ECB — Government Finance Statistics Guide, August 2014, particularly government production, remuneration, transfers and volume measures. https://www.ecb.europa.eu/pub/pdf/other/governmentfinancestatisticsguide201408en.pdf
[84] Eurostat — ESA 2010, chapter 9: supply and use tables; GDP, value added, intermediate consumption and imports. https://ec.europa.eu/eurostat/esa2010/chapter/view/9/